 Tweet
Tweet
Hi,
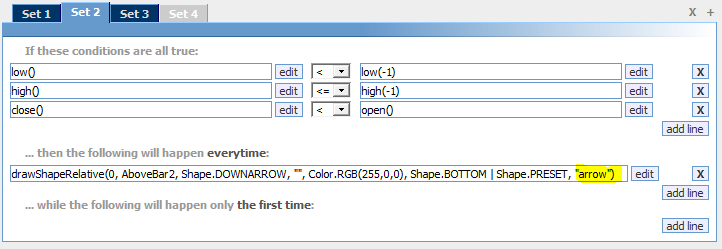
I created a very simple Candlestick Study using the Formula Wizard, and it doesn't seem to be updating correctly.
Eg: The Image shows a green arrow on the last displayed candle, but no arrow should be displayed because only the > high and >= low criteria has been met, but not the close > open.
The candle met all of the criteria earlier on, but then the arrow was still displayed when the candle changed bearish and all of the criteria was not met.
Also, is there any way to have the arrows displayed on the presently forming candle only?
Many thanks,
Paul
Attached Files

Comment