Announcement

Collapse
No announcement yet.

Problem creating an Alert via the EFS Formula Wizard

Collapse
X
 
  • Filter
  • Time
  • Show
Clear All
new posts

  • Problem creating an Alert via the EFS Formula Wizard

    Hi,

    I am new to eSignal and on a steep learning curve. I have tried to set up an alert for a chart I am running based around the following Envelope study settings;

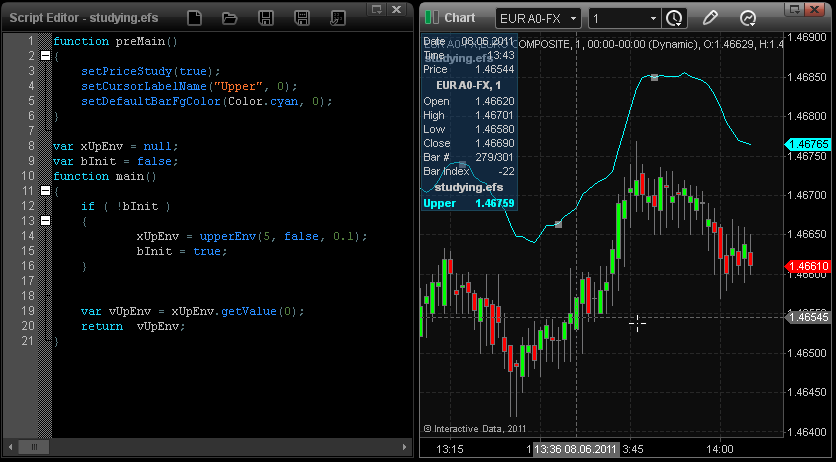
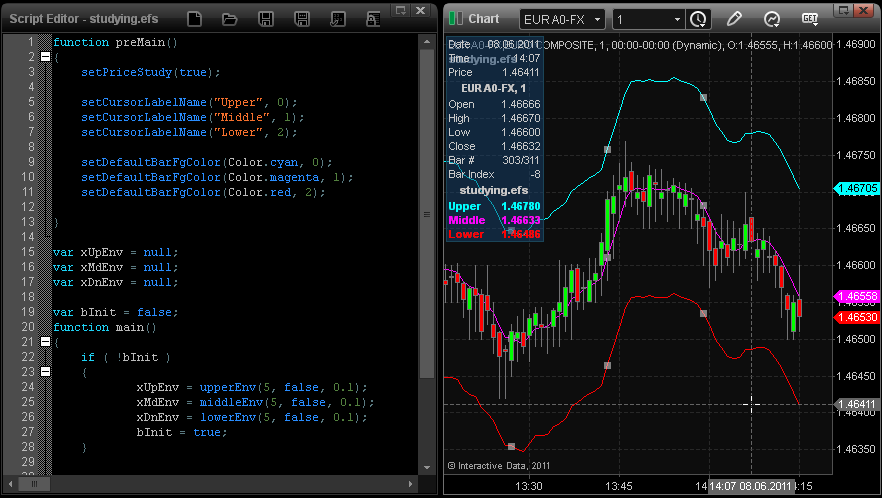
    Length, “5”; Offset, “0”; Source, “Close”; Percent, “0.3”; Exponential, “ticked”. Visually the chart features 5EMA line, either side of which are two lines that represent the 0.3% envelope. The price bars bounce around within this space.

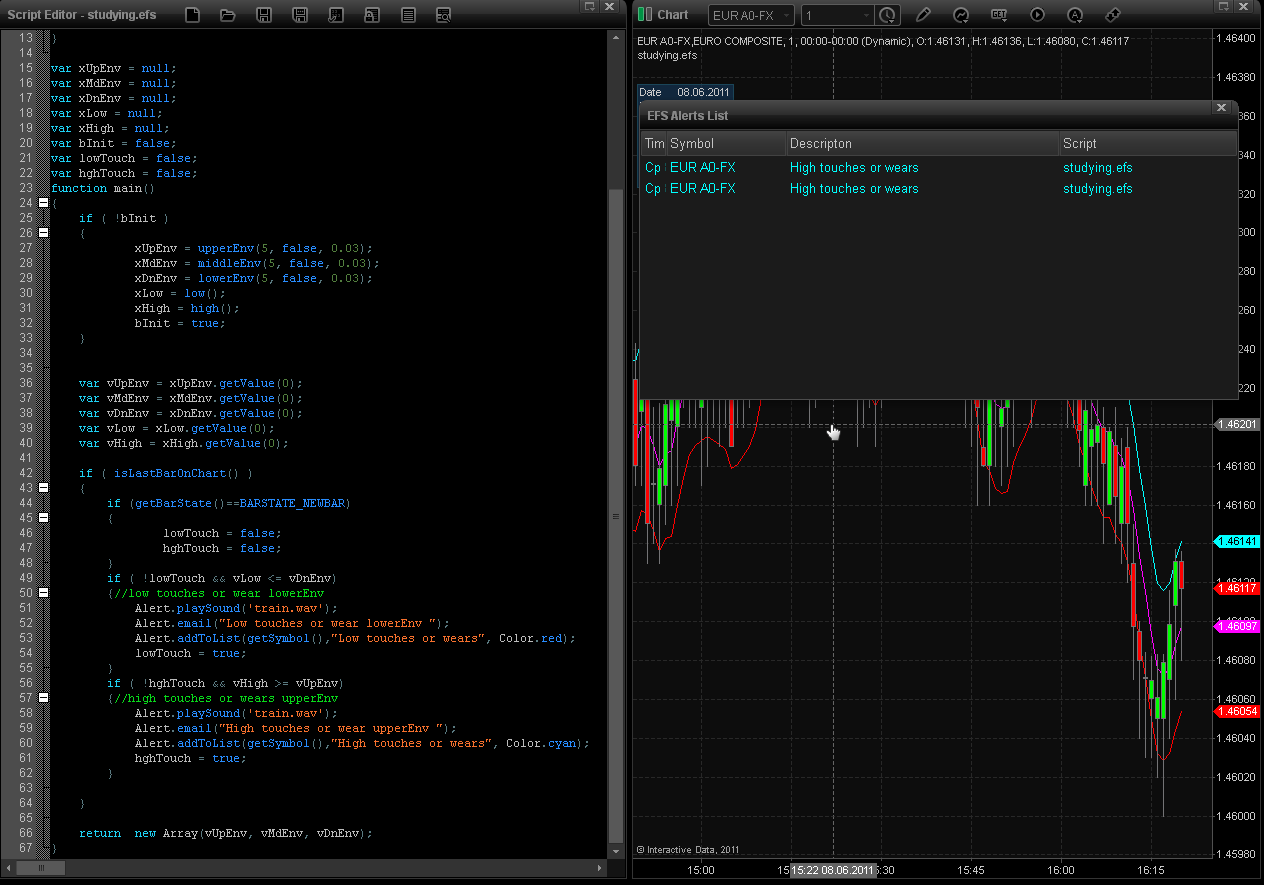
    My question is what do I need to do to create an email and sound alert for the instance in which a price bar high or low touches my envelope line…or ideally just before?

    I have searched the knowledge base and found one question that relates to mine. Given my current newness to eSignal, I may have used the wrong search terms but to the best of my present ability I could not find an answer..

    The code shown below represents my attempt at using the EFS wizard.

    All help much appreciated.

    Best Wishes

    Gary

    //{{EFSWizard_Description
    //
    // This formula was generated by the Alert Wizard
    //
    //}}EFSWizard_Description


    //{{EFSWizard_Declarations
    var vEnv5 = new EnvelopeStudy(5, 0, "Close", true, 0.29);
    var vLastAlert = -1;
    //}}EFSWizard_Declarations


    function preMain() {
    /**
    * This function is called only once, before any of the bars are loaded.
    * Place any study or EFS configuration commands here.
    */
    //{{EFSWizard_PreMain
    setPriceStudy(true);
    setStudyTitle("Gary");
    setCursorLabelName("?", 0);
    setDefaultBarStyle(PS_SOLID, 0);
    setDefaultBarFgColor(Color.purple, 0);
    setDefaultBarThickness(4, 0);
    setPlotType(PLOTTYPE_LINE, 0);
    //}}EFSWizard_PreMain

    }

    function main() {
    /**
    * The main() function is called once per bar on all previous bars, once per
    * each incoming completed bar, and if you don't have 'setComputeOnClose(true)'
    * in your preMain(), it is also called on every tick.
    */

    //{{EFSWizard_Expressions
    //{{EFSWizard_Expression_1
    //}}EFSWizard_Expression_1

    //}}EFSWizard_Expressions


    //{{EFSWizard_Return
    return vEnv5.getValue(EnvelopeStudy.BASIS, 0, 5);
    //}}EFSWizard_Return

    }

    function postMain() {
    /**
    * The postMain() function is called only once, when the EFS is no longer used for
    * the current symbol (ie, symbol change, chart closing, or application shutdown).
    */
    }

    //{{EFSWizard_Actions
    //{{EFSWizard_Action_1
    function onAction1() {
    Alert.playSound("C:\\Program Files (x86)\\eSignal\\Sounds\\Ding.wav");
    vLastAlert = 1;
    }
    //}}EFSWizard_Action_1

    //}}EFSWizard_Actions


  • #2
    Hi Gary
    1. At first, lets plot envelope series. For ploting envelope there are in eSignal 3 built-in functions: upperEnv, middleEnv, lowerEnv. Some details about it
    you can find here http://kb.esignalcentral.com/article...ticle=2062&p=4
    To understand the way of plotting series from efs, you should understand the way of script processing. The basical description of this is contained in this article
    http://kb.esignalcentral.com/article...ticle=2793&p=4. The essencials is:
    - main is processed on every history bars, and on every tick in streaming mode,
    - preMAin is processed only one time and serves for setting viewing parameters (not for series calculation).
    - series can be calculated in main and should be calculated only one time
    Below is the script, which plotes one series upperEnv


    Note, the construction
    PHP Code:
        if ( !bInit )
        {
                
    xUpEnv upperEnv(5false0.1);
                
    bInit true;
        } 
    is used to calculate series only once (not on every main execution)
    To use it, you should define bInit as gloabl variable.

    Note, that in preMain are seted properties for my plot
    setPriceStudy(true) - http://kb.esignalcentral.com/article...ticle=2203&p=4
    setCursorLabelName("Upper",0); - http://kb.esignalcentral.com/article...ticle=2202&p=4
    setDefaultBarFgColor(Color.cyan,0); - http://kb.esignalcentral.com/article...ticle=2193&p=4

    Note, that to return series it's used construction
    PHP Code:
    var vUpEnv xUpEnv.getValue(0);
    return  
    vUpEnv
    instead
    PHP Code:
    return xUpEnv
    Use return xUpEnv is possible but in script I will use the value of upperEnvelope on every bars, therefore I can calculate the current value before.

    2. Series lowerEnv è middleEnv can be plotteâ in the same way.


    3. Lets realize the logic of alert calling


    To check does low price touch or wear lowerEnv is used condition
    PHP Code:
        if ( !lowTouch && vLow <= vDnEnv )
            {
    //low touches or wear lowerEnv
                
    Alert.playSound('train.wav');
                
    Alert.email("Low touches or wear lowerEnv ");
                
    Alert.addToList(getSymbol(),"Low touches or wears"Color.red);
                
    lowTouch true;
            } 
    To check does high price touch or wear upperEnv is used condition
    PHP Code:
        if ( !hghTouch && vHigh >= vUpEnv)
            {
    //high touches or wears upperEnv
                
    Alert.playSound('train.wav');
                
    Alert.email("High touches or wear upperEnv ");
                
    Alert.addToList(getSymbol(),"High touches or wears"Color.cyan);
                
    hghTouch true;
            } 
    Alert should be called only in streaming mode, therefore it' used condition
    PHP Code:
        if ( isLastBarOnChart() ) 
    And, finally, to call alert only one time on a bar, there're in script two flags: lowTouch and hghTouch, which are swiched off, when new bar is plotted, and switched on, when price touches or wear channel first time after plotting bar

    I hope, this information will be useful for your trading.
    Last edited by eSignal_VladimirS; 06-08-2011, 05:32 AM.

    Comment


    • #3
      Thanks

      Hi Vladimir

      thanks very much for this. I am away at the moment but will take a look at the weekend.

      Best Wishes

      Gary

      Comment


      • #4
        Stuck

        Hi Vladimir

        I applied your code suggestions but am still stuck - as I said I really am a very basis programmer.

        I have created a file called SnapBack.efs and saved it in the formulas folder. The code it contains is as follows;

        function preMain()
        {
        setPriceStudy(true);

        setCursorLabelName("Upper", 0);
        setCursorLabelName("Middle", 1);
        setCursorLabelName("Lower", 2);

        setDefaultBarFgColor(Color.cyan, 0);
        setDefaultBarFgColor(Color.magenta, 1);
        setDefaultBarFgColor(Color.red, 2);

        }

        var xUpEnv = null;
        var xMdEnv = null;
        var xDnEnv = null;
        var xLow = null;
        var xHigh = null;
        var bInit = false;
        var lowTouch = false;
        var hghTouch = false;
        function main()
        {
        if ( !bInit )
        {
        xUpEnv = upperEnv(5, false, 0.03);
        xMdEnv = middleEnv(5, false, 0.03);
        xDnEnv = lowerEnv(5, false, 0.03);
        xLow = low();
        xHigh = high();
        bInit= true;
        }


        var vUpEnv = xUpEnv.getValue(0);
        var vMdEnv = xMdEnv.getValue(0);
        var vDnEnv = xDnEnv.getValue(0);
        var vLow = xLow.getValue(0);
        var vHigh = xHigh.getValue(0);

        if ( isLastBarOnChart() )
        {
        if (getBarState()==BARSTATE_NEWBAR)
        {
        lowTouch = false;
        highTouch = false;
        }
        if ( !lowTouch && vLow <= vDnEnv )
        {//low touches or wear lowerEnv
        Alert.playSound('train.wav');
        Alert.email("Low touches or wear lowerEnv ");
        Alert.addToList(getSymbol(),"Low touches or wears", Color.red);
        lowTouch = true;
        }
        if ( !hghTouch && vHigh >= vUpEnv)
        {//high touches or wears upperEnv
        Alert.playSound('train.wav');
        Alert.email("High touches or wear upperEnv ");
        Alert.addToList(getSymbol(),"High touches or wears", Color.cyan);
        hghTouch = true;
        }

        }

        return new Array(vUpEnv, vMdEnv, vDnEnv);
        }


        I am using eSignal 10.6. I went to File> New> Advanced Chart> Default Chart then changed the background colour etc then right clicked to Formulas> SnapBack.efs

        However, the lines are very close together and I have obviously done something wrong.

        In the attached file the top images shows what I have got via the EFS functionality and the bottom screen shot what it should look like.

        I can't see where I have gone worng.

        Any helpyou could give me Vladimir would be very much appreciated.

        With Very Best Wishes

        Gary
        Attached Files

        Comment


        • #5
          Hi Gary
          If you use the built-in Envelope, then the distance between lines is defined by parameter Percent. The same thing is with EFS functions upperEnv, etc.
          Look please at this article http://kb.esignalcentral.com/article...ticle=2062&p=4 . The mapping of built-in and EFS Function parameters is
          shown on picture bellow.
          In your case xUpEnv = upperEnv(5, false, 0.03); the Percent parameter is equal 0.03, therefore lines are so closer.
          The most simple desicion to select the appropriate value of Percent for functions upperEnv, etc. and change it in script.
          The most flexible desicion to make this parameter as input parameter of function.
          To do it you can read this article http://kb.esignalcentral.com/article...ticle=2226&p=4
          Attached Files

          Comment

          Working...
          X