Announcement

Collapse
No announcement yet.

TickiExtremes.efs

Collapse
X
 
  • Filter
  • Time
  • Show
Clear All
new posts

  • TickiExtremes.efs

    Jason,

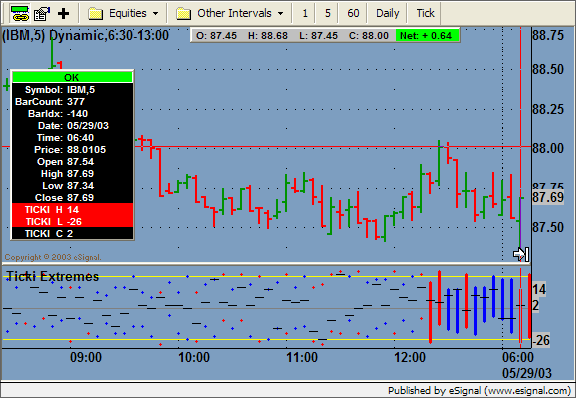
    I downloaded the new efs for this study and my chart looks nothing like yours. I do not have the bars, just dots all over the place.

    I am sure I am doing something wrong.

    Any suggestions?

    DaTr8dr

  • #2
    Hello DaTr8dr,

    If your chart's interval is set to daily, you won't get the HL bars. Let me know if you need this formula for the daily interval. We'll have to make a version similar to TickExtremesDaily.efs.

    This formula is intended for intra-day intervals and will only draw the HL bars for the most recent 150 bars. So if you have scrolled back in time beyond those 150 bars, you'll see dots for the high and low. We have to limit the number of bars because the formula uses the drawLineRelative() function. Having too many lines slows the formula down.

    Jason K.
    Project Manager
    eSignal - an Interactive Data company

    EFS KnowledgeBase
    JavaScript for EFS Video Series
    EFS Beginner Tutorial Series
    EFS Glossary
    Custom EFS Development Policy

    New User Orientation

    Comment


    • #3
      actually, I had this efs on a 28 tick chart on the YM.

      Maybe it is not good for this chart.

      Thanks.

      DaTr8dr

      Comment


      • #4
        Also, Jason, do you know when/if eSignal will allow drawing tools to be active on "tick" charts?

        Thanks,

        DaTr8dr

        Comment

        Working...
        X