Announcement

Collapse
No announcement yet.

Tick indicator study ?

Collapse
X
 
  • Filter
  • Time
  • Show
Clear All
new posts

  • #16
    Hello Matt,

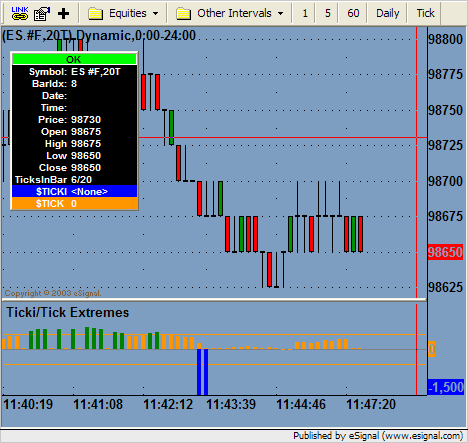
    I've identified the problem and below is an updated formula that should work for you. The problem is related to how calls to high(0, 1, "$tick") works. Because our chart is using an 800T interval, high() returns the high for $tick over the last 800 ticks for $tick, not the chart's symbol. As we've seen in my previous message, 800 ticks of $tick covers a much greater period of time that 800 ticks of ES. The fix here corrects the problem by building the HLC information as ticks come in. Therefore, on tick or raw tick charts, this formula will not be able to display the historical information. The formula will work as normal on intraday intervals.

    TickExtremes.efs
    Jason K.
    Project Manager
    eSignal - an Interactive Data company

    EFS KnowledgeBase
    JavaScript for EFS Video Series
    EFS Beginner Tutorial Series
    EFS Glossary
    Custom EFS Development Policy

    New User Orientation

    Comment


    • #17
      jason

      Scott here...
      I expected this modification to help me with my request as well - being ... allow a 110 tic es chart to not have 110 tics of the $tick for each bar, but actually only as many tics of the $tic as fit when the new es bar posts.

      However , i put a 110 tic chart of the es in right now and only get about 20 $tick bars in the indicator pane. I imagine because its still doing the same thing as prior when it uses 110 tics of $tick for each bar as well ????

      Thanks
      sg

      Comment


      • #18
        Hello Scott,

        You won't see anything right now because the $Tick is not updating in real time. You'll have to test this tomorrow during regular trading hours.

        In regards to your request, I'm not sure item #4 is possible. Bars are created based on the chart's interval. Perhaps you could give me a more detailed example. I’m not sure I understand what you're asking for.
        Jason K.
        Project Manager
        eSignal - an Interactive Data company

        EFS KnowledgeBase
        JavaScript for EFS Video Series
        EFS Beginner Tutorial Series
        EFS Glossary
        Custom EFS Development Policy

        New User Orientation

        Comment


        • #19
          jason

          I was hoping to be able to replicate a chart someone i know uses with aspen graphics...

          the indicator is basically a histogram(like tick extremes) that is color coated to be orange if the $tick is -500<>500 or red if its <-500 or green if its >+500. Additionally i was hoping to be able to also see any spikes in $ticki on the same histogram bar ONLY IF IT BREAKS +/- 24... this would be represented by a 'blue' extension of the same $tick histogram bar above /below the $tick reading. For example ... if the tick was 800 & ticki was 25... the bar would be green up to 800 and then blue from 800 to 1500. If it was a reading of 1200 and +28... the bar would be green up to 1200 & blue from 1200- 1500... and so on... (vice versa for red / blue with negative readings).

          The harder part which iwas finding to be a tough feat is...
          Have the indicator histogram only print 'IF' there is new data between the last symbol bar and the latest symbol bar. This obviously is relevant when using a tic interval for the symbol. That way , if you get a fast mkt and the 110 tic symbol bars are printing very fast... you may actually have gaps in the indicator pane - because new $tick data may not have been updated.

          It may sound odd, but its cool because you can see volume spikes by the gaps... and volume doldrums by the bunchy histogram bars .

          Let me know if you cant pull this out of your hat ?

          Thanks
          scott

          Comment


          • #20
            Hello Scott,

            Thank you for the detailed description. I think we can do this. I'll see what I can come up with tomorrow morning.
            Jason K.
            Project Manager
            eSignal - an Interactive Data company

            EFS KnowledgeBase
            JavaScript for EFS Video Series
            EFS Beginner Tutorial Series
            EFS Glossary
            Custom EFS Development Policy

            New User Orientation

            Comment


            • #21
              hi jason,

              looks good.
              there is just no bars for (at least) the previous day.
              I am using a 10 day tick template, that's the max , isn't it ?

              thanks
              Attached Files

              Comment


              • #22
                Hello Matt,

                Because of the tick interval, we can't recreate the historical bars when you first apply the formula. An 800T bar of $Tick covers over an hour of ticks, which was why we were seeing $Tick bars with highs and lows close to +1000/-1000. An 800T bar of ES covers a few minutes. It's a synchronization problem. We are trying to compare apples and oranges. So, the only way to synchronize the two symbols is to collect the data tick-by-tick in real time so that we get an accurate comparison of OHLC data for both symbols that cover the same time interval, which varies in the case of tick intervals.

                The formula can only collect the data in real time for tick intervals and create the bars going forward. If you reload the formula, the bar's that have been collected will be wiped out and it will start over at the most current bar. It's a limitation, but it's the best we can do for now.
                Jason K.
                Project Manager
                eSignal - an Interactive Data company

                EFS KnowledgeBase
                JavaScript for EFS Video Series
                EFS Beginner Tutorial Series
                EFS Glossary
                Custom EFS Development Policy

                New User Orientation

                Comment


                • #23
                  rt704, to unsubscribe, go to top of the forums page and click on "User CP." You will then see a list of your subscribed forums and threads. Simply click on the unsubscribe link and you'll be set.

                  Jason K.
                  Project Manager
                  eSignal - an Interactive Data company

                  EFS KnowledgeBase
                  JavaScript for EFS Video Series
                  EFS Beginner Tutorial Series
                  EFS Glossary
                  Custom EFS Development Policy

                  New User Orientation

                  Comment


                  • #24
                    good enough.

                    thanks jason

                    Comment


                    • #25
                      Hello Scott,

                      I have something for you to test. I think it handles all your conditions. Let me know what you think.

                      TickiTick.efs

                      Jason K.
                      Project Manager
                      eSignal - an Interactive Data company

                      EFS KnowledgeBase
                      JavaScript for EFS Video Series
                      EFS Beginner Tutorial Series
                      EFS Glossary
                      Custom EFS Development Policy

                      New User Orientation

                      Comment


                      • #26
                        hey jason, that's a cool one for sure.

                        shouldn't the blue spike stick though ?
                        once ticki goes to +- 24 it appears and as soon as the ticki drops it disappears.
                        so it basically just flashes.
                        one other thing that is kind of distracting to me.
                        the blue "spike" goes all the way to +-1500.
                        to me it would be more "visual " and proportional if it shows just as a cap or a blue dot on the tick bar.

                        sorry scott for butting in ;-)

                        Comment


                        • #27
                          Jason &amp; Matt

                          Yes matt great idea...
                          The spike would be nicer just as a cap (perhaps equivalent to 100 pts in $tick or something to that degree.

                          Ill test it out otherwise as i was out of the mkt today, but thanks a ton for your efforts so far Jason - the .png looks awesome.
                          sg

                          Comment


                          • #28
                            one more thing.
                            I do miss the clear high low last reading of the tick extremes efs.
                            maybe you could add it (as an option).

                            thanks again

                            Comment


                            • #29
                              Jason

                              Ok so at first glance, besides matts idea of shrinking the blue spikes down a bit to only be a cap on the bar, i have the following thoughts:

                              a. awesome overall :-)
                              b. in a 10 tic chart - i see that in many instances there are only 2 or 3 seconds btwn bars, yet there is a different tick reading in the indicator pane ?? I would expect that $ticki only updates every 6 seconds and therefore there should be some 'gaps' btwn $tick readings... (which is what im trying to accomplish). Actually at 2nd glance - it appears there are some 0 readings for $tick but it still puts an 'organge' nob on top of the 0 line. Can we make it so that if $tick is 0 , then it is eithr blank or the same color as the 0 line - so its in essence invisible ?


                              c. is it possible that during slow times when tics are spread out further in time that there are NO histograms that stretch both above & below the 0 point ? Everthing i see is on 1 side or the other of the 0 line ??

                              d. I hate to be a beggar & choose BUT :-) ... can you allow for user adjustments to the size of the histogram bar's width ? When i shrink the time (x) axis, the indicator bars become hard to ditsinguis since they are all painted together.

                              Thanks a gazillion.

                              sg

                              Comment


                              • #30
                                last reading...

                                Yea if its possible as an option that would be great, i just hope not to get locked into that if i dont want it.

                                Comment

                                Working...
                                X