Announcement

Collapse
No announcement yet.

Tick indicator study ?

Collapse
X
 
  • Filter
  • Time
  • Show
Clear All
new posts

  • #46
    Hello Scott,

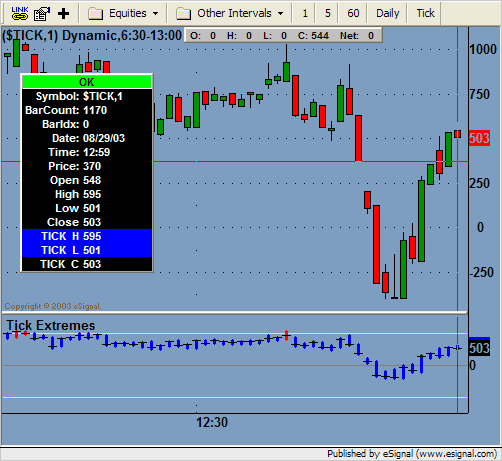
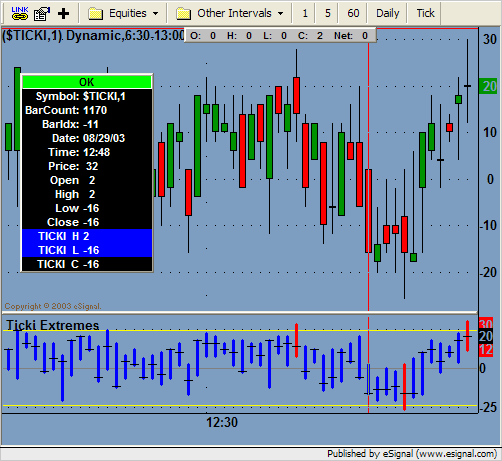
    I've changed the formula so that the Ticki markers will have a minimum thickness of four and will match the thickness of the bars if set above 4. I've also extended the marker another 100 points.

    TickiTick.efs

    As to the historical display when using a tick interval, please review my comments earlier in this thread about synchronization about 24 posts prior to this one. In short, you are correct in that the formula can only display the information going forward.
    Jason K.
    Project Manager
    eSignal - an Interactive Data company

    EFS KnowledgeBase
    JavaScript for EFS Video Series
    EFS Beginner Tutorial Series
    EFS Glossary
    Custom EFS Development Policy

    New User Orientation

    Comment


    • #47
      jason

      Ok great work.
      Ive attached a png of my screen because there is something odd with the ticki that its posting a blue blip in an odd spot at 15:20ish.

      sg
      Attached Files

      Comment


      • #48
        Hello Scott,

        I found the problem and fixed it. Let me know if you come across anything else.

        TickiTick.efs
        Jason K.
        Project Manager
        eSignal - an Interactive Data company

        EFS KnowledgeBase
        JavaScript for EFS Video Series
        EFS Beginner Tutorial Series
        EFS Glossary
        Custom EFS Development Policy

        New User Orientation

        Comment


        • #49
          Jason

          Hey Jason,
          I think i found something wrong with that indicator you made for us last week or two. It seems that when i compare the ticki / tick indicator up against a plain vanilla chart of the $tick - it is not in sync. See the pictures attached below... you will see that the high in the $ticks do not match in both charts as far as time frame is concerned.
          Thanks
          scott
          Attached Files

          Comment


          • #50
            jason chart 2

            Here is the es chart with the ticki tick on the bottom as an indicator.
            Le me know what you think...
            sg
            Attached Files

            Comment


            • #51
              Hello Scott,

              Looks like you are comparing Ticki Exteremes to $Tick, which will be different. Compare Tick Extremes to $Tick. Gotta watch out for that little i.


              Ticki Extremes & $Ticki
              Jason K.
              Project Manager
              eSignal - an Interactive Data company

              EFS KnowledgeBase
              JavaScript for EFS Video Series
              EFS Beginner Tutorial Series
              EFS Glossary
              Custom EFS Development Policy

              New User Orientation

              Comment


              • #52
                Jason

                I dont think thats what i was doing.
                Look at the blue hash marks on the charts i posted. You will see in 1 of them its a chart of the ESU3 with a ticki /tick indicator that actually has the $tick as the histogram. It only shows the $ticki as a blue blip when its over 24.

                The 2nd chart is a chart of the $tick... so if they are both the same timeframe, shouldnt they both show the same data ?
                Again - look at the matchup of the blue hash marks - they are both at the same time with different $tick data.
                sg

                Comment


                • #53
                  Hello sgarbs,

                  I found the problem and fixed it. No bug, just a coding error on my part. I also added a small enhancement that shows the blue tips on the historical bars that breached the +/-24 mark when you first apply the formula. It wasn't showing those previously. Try the new version and let me know if you see any more problems.

                  TickiTick.efs
                  Jason K.
                  Project Manager
                  eSignal - an Interactive Data company

                  EFS KnowledgeBase
                  JavaScript for EFS Video Series
                  EFS Beginner Tutorial Series
                  EFS Glossary
                  Custom EFS Development Policy

                  New User Orientation

                  Comment


                  • #54
                    still the same prob...

                    Jason,
                    So maybe i didnt explain my problem - ill try better now.

                    1. Open 2 charts next to one another.
                    2. In the 1st chart make it : $tick 1 minute.
                    2(a) Note at 2.43PM that the $tick level hits a high of 1341.
                    3. In the 2nd chart make it ES U3 (1 minute) with tickitick indicator below.
                    3(b) You will notice that at 14.43 pm , the $tick level in the indicator is only around 1000... and its not until 14.51 - that it hits that price of 1341.

                    Maybe im missing something ... but shouldnt they be in sync >?
                    Thanks bud.

                    scott

                    Comment


                    • #55
                      Hello Scott,

                      Thank you for the detailed setup instructions. Are you using a 24-hour time template by chance? I have a feeling that the problem you are seeing has to do with the zero-volume bars bug. This problem has already been reported to our development team. I do not have an ETA for a solution to this, but they are aware of it. The way the advanced charts works currently, it leaves out any bars that do not have any trades, which creates a sync problem. The problem occures when comparing a symbol to itself as an overlay symbol in another chart with a different symbol using a time template that has an end time after the last bar time for the symbol in question. The chart tries to line up the overlay data by relative bar index rather than the time stamp of each coinciding bar.

                      To better understand the problem, let's consider the two charts in your example where #2 is using a 24-hour time template set to ES U3. The time template of #1 doesn't matter. Now look at the bars 0, -1 and -2 on chart #2. At the present moment (bar 0 = 16:34), the close values for $TICK in #2 are 93, 91 and 105, respectively. Compare those values to chart #1's bar 0, -1 and -2. They are the same values. Do you see what's happing? In chart #2, the entire collection of price data for $TICK is being shifted to the right to line up the most recent $TICK bar with the current ES U3 bar, which do not have the same time stamp. They are the bars with the same bar index between the two charts. You're only solution currently is to use one of the RTH time templates in chart #2.

                      Technically, chart #2 should be showing a flat line at 93 for the open, high, low and close for $TICK because the last valid bar for $TICK occurred at 13:07 and had a OHLC of 93.


                      Jason K.
                      Project Manager
                      eSignal - an Interactive Data company

                      EFS KnowledgeBase
                      JavaScript for EFS Video Series
                      EFS Beginner Tutorial Series
                      EFS Glossary
                      Custom EFS Development Policy

                      New User Orientation

                      Comment


                      • #56
                        jason

                        So let me undestand -
                        The bottom line is that the only way to see the $tick correctly as either an indicator in $tickitick OR as a symbol compare... is to have the main symbo (ES in my case) - have a time template that ends at 4pm exactly ?

                        Bummer - i only use this in a 1 minute or 110 tic chart 24 hours... and like to see divergences line up...

                        Any other short term fixes ?

                        Thanks for the hard work & great description though...
                        scott

                        Comment


                        • #57
                          Hi Jason,

                          just tried your latest version and what I find is, it puts a blue ticki marker on the hi/lo bar no matter what. I watched it in real-time and as soon as it prints the new tick bar, it puts a blue dot on top even though ticki was at 8. Comparing it to the old version I noticed the old printing a correct blue dot at the bottom in strong down bar, yet the latest version still prints it on top. I am using a 800 tick chart of the es.

                          In reference to Scotts problem, I have found the only way to use ticki/tick correctly is having it "on" real-time, to load it later on gives all kinds of bogus prints, mostly offset to the right.

                          Attached Files
                          Last edited by matt hellrich; 09-03-2003, 08:45 AM.

                          Comment


                          • #58
                            can't seem to post 2 images.

                            here is an image of the new version.
                            Attached Files

                            Comment


                            • #59
                              Hello Matt,

                              I was able to reproduce the problem you were having. The updated version below should fix that problem. I also added an option to change the value for the Ticki marker that I used to test for the problem you found. Previously, the Ticki marker was hard coded at +/-24, which is still the default but now you can enter whatever value you want. Enter it as a positive number.

                              TickiTick.efs
                              Jason K.
                              Project Manager
                              eSignal - an Interactive Data company

                              EFS KnowledgeBase
                              JavaScript for EFS Video Series
                              EFS Beginner Tutorial Series
                              EFS Glossary
                              Custom EFS Development Policy

                              New User Orientation

                              Comment


                              • #60
                                Thanks Jason,

                                That fixed it. A really great tool.

                                Just a minor thing: any chance to get the "footprint" smaller ?
                                Attached Files

                                Comment

                                Working...
                                X