 Tweet
Tweet
File Name: BeanTICK_Strategy.efs
Description:
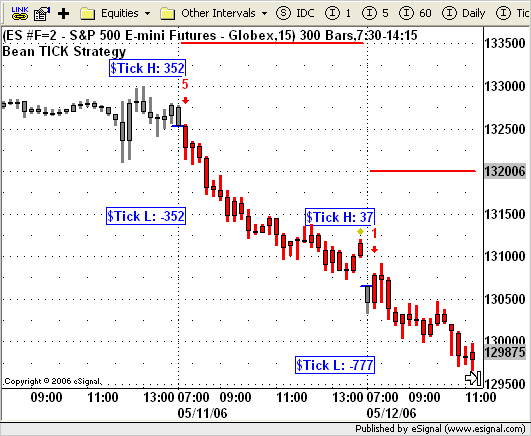
This study is based on the May 2006 article, Using The TICK To Identify The Intraday Trend, by David Bean.
Formula Parameters:
Local Start Time of Entry Bar: 945
R Multiplier: 5
Contract's Point Value: 50
Local End Time of Trading Session: 1615
Notes:
* Study must be used on a 15 minute or lower interval only.
* Study is configured for futures contracts only.
* If used in any time zone other than US Eastern Standard time, the
Start Time and End Time parameters need to be modified to local time.
* Study parameters are set for Emini S&P futures contract (ES #F=2) and
Eastern Standard time.
* Study is compatible for real time use and Back Testing with the
Strategy Analyzer.
* Study requires a time template that includes the bars based
on the specified Start Time and End Time parameters.
This formula also requires eSignal version 7.9.1 or later. The related article is copyrighted material. If you are not a subscriber of Active Trader Magazine, please visit www.activetradermag.com.
Download File:
BeanTICK_Strategy.efs (version 2.0 updated 5/19/2006)
EFS Code:
Description:
This study is based on the May 2006 article, Using The TICK To Identify The Intraday Trend, by David Bean.
Formula Parameters:
Local Start Time of Entry Bar: 945
R Multiplier: 5
Contract's Point Value: 50
Local End Time of Trading Session: 1615
Notes:
* Study must be used on a 15 minute or lower interval only.
* Study is configured for futures contracts only.
* If used in any time zone other than US Eastern Standard time, the
Start Time and End Time parameters need to be modified to local time.
* Study parameters are set for Emini S&P futures contract (ES #F=2) and
Eastern Standard time.
* Study is compatible for real time use and Back Testing with the
Strategy Analyzer.
* Study requires a time template that includes the bars based
on the specified Start Time and End Time parameters.
This formula also requires eSignal version 7.9.1 or later. The related article is copyrighted material. If you are not a subscriber of Active Trader Magazine, please visit www.activetradermag.com.
Download File:
BeanTICK_Strategy.efs (version 2.0 updated 5/19/2006)
EFS Code:
PHP Code:
/***************************************

Provided By : eSignal (c) Copyright 2006

Description:  Using The TICK To Identify The Intraday Trend

              by David Bean


Version 2.0  05/17/2006


Version 1.0 Notes:

* May 2006 Issue of Active Trader Magazine

* Study requires version 7.9.1 or higher.

* Study must be used on a 15 minute or lower interval only.

* Study is configured for futures contracts only.

* If used in any time zone other than US Eastern Standard time, the

    Start Time and End Time parameters need to be modified to local time.

* Study parameters are set for Emini S&P futures contract (ES #F=2) and

    Eastern Standard time.

* Study is compatible for real time use and Back Testing with the

    Strategy Analyzer.

* Study requires a time template that includes the bars based

    on the specified Start Time and End Time parameters.


Version 2.0 Notes:

* Logic corrected for real time processing on intervals less than 15 min

    for stop and limit entries.

* Display enhancements to show the 830 (15 min interval) $Tick high and

    low as well as a blue line showing the entry price level when a

    trade is taken.


Formula Parameters:                 Defaults:

Local Start Time of Entry Bar       945

R Multiplier                        5

Contract's Point Value              50

Local End Time of Trading Session   1615

***************************************/


function preMain() {

    setPriceStudy(true);

    setStudyTitle("Bean TICK Strategy ");

    setCursorLabelName("Position", 0);

    setCursorLabelName("Stop", 1);

    setDefaultBarThickness(1, 0);

    setDefaultBarThickness(2, 1);

    setDefaultBarFgColor(Color.grey, 0);

    setDefaultBarFgColor(Color.red, 1);

    setPlotType(PLOTTYPE_DOT, 0);

    setPlotType(PLOTTYPE_FLATLINES, 1);

    setColorPriceBars(true);

    setDefaultPriceBarColor(Color.grey);

    setShowTitleParameters(false);

    setDefaultFont("Arial", 12 , Color.blue, Text.BOLD|Text.FRAME|Text.RIGHT)


    var fp1 = new FunctionParameter("nStart", FunctionParameter.NUMBER);

        fp1.setName("Local Start Time of Entry Bar");

        fp1.setDefault(945);

    var fp2 = new FunctionParameter("nR", FunctionParameter.NUMBER);

        fp2.setName("R Multiplier");

        fp2.setLowerLimit(1);

        fp2.setDefault(5);

    var fp3 = new FunctionParameter("nPoints", FunctionParameter.NUMBER);

        fp3.setName("Contract's Point Value");

        fp3.setLowerLimit(0);

        fp3.setDefault(50);

    var fp5 = new FunctionParameter("nEnd", FunctionParameter.NUMBER);

        fp5.setName("Local End Time of Trading Session");

        fp5.setDefault(1615);

}


var bVersion = null;

var bInit = false;


var xAvgRange = null;

var sPosition = "Flat";

var nStop = null;

var bBT = true;         // allow back testing

var bNewDay = false;

var bEntryBar = false;


function main(nStart, nR, nPoints, nEnd) {

    if (bVersion == null) bVersion = verify();

    if (bVersion == false) return;


    if (getInterval() > 15) {

        drawTextAbsolute(5, 35, "This study requires a chart interval of 15 minutes or lower.",

            Color.white, Color.blue, Text.RELATIVETOBOTTOM|Text.RELATIVETOLEFT|Text.BOLD|Text.LEFT,

            null, 13, "error");

        return;

    }


    var nState = getBarState();

    var nTime = (hour(0)*100) + minute(0);


    if (bInit == false) {

        xAvgRange = efsInternal("calcAR", inv(15));

        bInit = true;

    }


    if (day(0) != day(-1)) {

        bNewDay = true;

    }

    if (bNewDay == true) {

        if (nTime >= nStart) {

            bEntryBar = true;

            bNewDay = false;

        }

    }


    if (isLastBarOnChart() == true) bBT = false;


    // Exit

    if (sPosition != "Flat") {

        var nBarTime = (hour(0)*100) + minute(0);

        var nO = open(0);

        var nH = high(0);

        var nL = low(0);

        var nStopLimit = nStop;

        if (sPosition == "Long" && nL <= nStop) { // Exit 1

            if (nO < nStop) nStopLimit = nO;

            if (bBT == true) Strategy.doSell("Long Stop", Strategy.STOP, Strategy.THISBAR, Strategy.ALL, nStopLimit);

            doPriceBarColors();

            sPosition = "Flat";

            Alert.playSound("train.wav");

            drawShape(Shape.DIAMOND, BelowBar1, Color.khaki, "exit"+rawtime(0));

        } else if (sPosition == "Short" && nH >= nStop) { // Exit 1

            if (nO > nStop) nStopLimit = nO;

            if (bBT == true) Strategy.doCover("Short Stop", Strategy.STOP, Strategy.THISBAR, Strategy.ALL, nStopLimit);

            doPriceBarColors();

            sPosition = "Flat";

            Alert.playSound("train.wav");

            drawShape(Shape.DIAMOND, AboveBar1, Color.khaki, "exit"+rawtime(0));

        } else if (nBarTime >= (nEnd-getInterval()) ) {  // Exit 2

            if (bBT == true) {

                if (sPosition == "Long")  Strategy.doSell("End of Day", Strategy.CLOSE, Strategy.THISBAR);

                if (sPosition == "Short") Strategy.doCover("End of Day", Strategy.CLOSE, Strategy.THISBAR);

            }

            doPriceBarColors();

            sPosition = "Flat";

            Alert.playSound("train.wav");

            drawShape(Shape.DIAMOND, AboveBar1, Color.khaki);

        } else if (day(0) != day(-1) ) {  // Exit 2 (lack of bars due to low volume)

            if (bBT == true) {

                if (sPosition == "Long")  Strategy.doSell("End of Day", Strategy.MARKET, Strategy.THISBAR);

                if (sPosition == "Short") Strategy.doCover("End of Day", Strategy.MARKET, Strategy.THISBAR);

            }

            doPriceBarColors();

            sPosition = "Flat";

            Alert.playSound("train.wav");

            drawShape(Shape.DIAMOND, AboveBar1, Color.khaki);

        }

    } else {

        if (nState == BARSTATE_NEWBAR) nStop = null;

    }


    if (nTime >= nStart+15) bEntryBar = false;


    // Entry

    if (bEntryBar == true && sPosition == "Flat") {

        var sTagH         = "tickH" + day(0)+month(0)+year(0);

        var sTagL         = "tickL" + day(0)+month(0)+year(0);

        var nEntryPrice   = close(0);

        var nTickHigh_1   = high(  -1, sym("$TICK,15"));

        var nTickLow_1    = low(   -1, sym("$TICK,15"));

        var nTickClose_1  = close( -1, sym("$TICK,15"));

        var nOpen_1       = open(  -1, inv(15));

        var nHigh_1       = high(  -1, inv(15));

        var nLow_1        = low(   -1, inv(15));

        var nClose_1      = close( -1, inv(15));

        var nAvgRange_1   = xAvgRange.getValue(-1);

        var nDailyOpen    = open(   0, inv("D"));

        var nDailyLow_1   = low(   -1, inv("D"));

        var nDailyClose_1 = close( -1, inv("D"));

        var sRule = 0;

        if (nTickHigh_1 == null || nTickLow_1 == null || nAvgRange_1 == null) return;


        // draw $Tick high and low values

        drawText("$Tick H: " + nTickHigh_1, AboveBar4, null, null, sTagH);

        drawText("$Tick L: " + nTickLow_1, BelowBar4, null, null, sTagL);


        // Long Entry

        if (nTickLow_1 > -350) {

            if (nTickHigh_1 > 750) { // Rule 1

                sPosition = "Long";

                sRule = 1;

            } else if (nTickClose_1 > 500) { // Rule 2

                sPosition = "Long";

                sRule = 2;

            } else if (nClose_1 > (nOpen_1 + nAvgRange_1) ) { // Rule 3

                sPosition = "Long";

                sRule = 3;

            }

            if (sPosition == "Long") {

                if (bBT == true) Strategy.doLong("Rule " + sRule, Strategy.MARKET, Strategy.THISBAR);

                nEntryPrice = open(0);

                drawShape(Shape.UPARROW, BelowBar2, Color.green, rawtime(0));

                drawText(sRule, BelowBar3, Color.green, Text.CENTER|Text.BOLD, rawtime(0));

                drawLineRelative(0, nEntryPrice, -2, nEntryPrice, PS_SOLID, 2, Color.blue, rawtime(0));

                Alert.playSound("pop.wav");

            }

        }


        // Short Entry

        if (sPosition == "Flat" && nTickHigh_1 < 750) {

            if (nDailyOpen > (nDailyLow_1 - (2*nAvgRange_1)) && nTickLow_1 < -350 &&

                low(0) <= nDailyOpen && high(0) >= nDailyOpen) { // Rule 1

                sPosition = "Short";

                sRule = 1;

            } else if (nDailyOpen > (nDailyLow_1 - (2*nAvgRange_1)) && nTickClose_1 < -100 &&

                low(0) <= nDailyOpen && high(0) >= nDailyOpen) { // Rule 2

                sPosition = "Short";

                sRule = 2;

            } else if (nClose_1 > nDailyClose_1 && nTickLow_1 < -350 &&

                low(0) <= nDailyClose_1 && high(0) >= nDailyClose_1) { // Rule 3

                sPosition = "Short";

                sRule = 3;

            } else if (nClose_1 > nDailyClose_1 && nTickClose_1 < -100 &&

                low(0) <= nDailyClose_1 && high(0) >= nDailyClose_1) { // Rule 4

                sPosition = "Short";

                sRule = 4;

            } else if (nClose_1 < (nOpen_1 - nAvgRange_1) ) { // Rule 5

                sPosition = "Short";

                sRule = 5;

            }

            if (sPosition == "Short") {

                if (bBT == true) {

                    if (sRule == 1 || sRule == 2) {

                        Strategy.doShort("Rule " + sRule, Strategy.LIMIT, Strategy.THISBAR, Strategy.DEFAULT, nDailyOpen);

                        nEntryPrice = nDailyOpen;

                    } else if (sRule == 3 || sRule == 4) {

                        Strategy.doShort("Rule " + sRule, Strategy.STOP, Strategy.THISBAR, Strategy.DEFAULT, nDailyClose_1);

                        nEntryPrice = nDailyClose_1;

                    } else if (sRule == 5) {

                        Strategy.doShort("Rule " + sRule, Strategy.MARKET, Strategy.THISBAR);

                        nEntryPrice = open(0);

                    }

                }

                drawShape(Shape.DOWNARROW, AboveBar2, Color.red, rawtime(0));

                drawText(sRule, AboveBar3, Color.red, Text.CENTER|Text.BOLD, rawtime(0));

                drawLineRelative(0, nEntryPrice, -2, nEntryPrice, PS_SOLID, 2, Color.blue, rawtime(0));

                Alert.playSound("ding.wav");

            }

        }


        // Set Stop

        if (sPosition != "Flat") {

            bEntryBar = false;

            nStop = (nR * nPoints * xAvgRange.getValue(0)) / nPoints;

            if (sPosition == "Long") {

                nStop = open(0) - nStop;

            } else if (sPosition == "Short") {

                if (sRule == 1 || sRule == 2)       nStop = nDailyOpen + nStop;

                else if (sRule == 3 || sRule == 4)  nStop = nDailyClose_1 + nStop;

                else if (sRule == 5)                nStop = open(0) + nStop;

            }

        }

    }


    // Color Price Bars

    doPriceBarColors();


    return new Array(sPosition, nStop);

}


function doPriceBarColors() {

    if (Strategy.isLong() || sPosition == "Long") setPriceBarColor(Color.green);

    else if (Strategy.isShort() || sPosition == "Short") setPriceBarColor(Color.red);

    return;

}


var xRange = null;


function calcAR(nInv) {

    if (xRange == null) xRange = efsInternal("calcRange");

    return sma(27, xRange);

}


function calcRange() {

    return high(-1) - low(-1);

}


function verify() {

    var b = false;

    if (getBuildNumber() < 730) {

        drawTextAbsolute(5, 35, "This study requires version 7.9.1 or later.",

            Color.white, Color.blue, Text.RELATIVETOBOTTOM|Text.RELATIVETOLEFT|Text.BOLD|Text.LEFT,

            null, 13, "error");

        drawTextAbsolute(5, 20, "Click HERE to upgrade.@URL=http://www.esignal.com/download/default.asp",

            Color.white, Color.blue, Text.RELATIVETOBOTTOM|Text.RELATIVETOLEFT|Text.BOLD|Text.LEFT,

            null, 13, "upgrade");

        return b;

    } else {

        b = true;

    }


    return b;

}