 Tweet
Tweet
File Name: TripleExponentialAverage.efs
Description:
Triple Exponential Average
Formula Parameters:
Color line null: Green
Length: 9
Gradient Color: 200
Display Title Value: False
Notes:
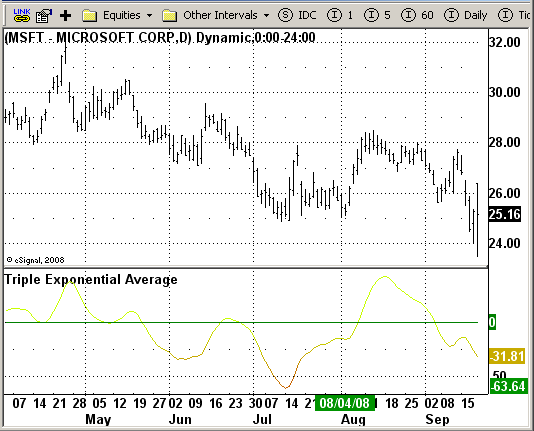
The Triple Exponential Average (TRIX) indicator is an oscillator used
to identify oversold and overbought markets and it can also be used
as a momentum indicator. As is common with many oscillators, TRIX
oscillates around a zero line. When used as an oscillator, a positive
value indicates an overbought market while a negative value indicates
an oversold market. As a momentum indicator, a positive value suggests
momentum is increasing while a negative value suggests momentum is
decreasing.
Download File:
TripleExponentialAverage.efs
EFS Code:
Description:
Triple Exponential Average
Formula Parameters:
Color line null: Green
Length: 9
Gradient Color: 200
Display Title Value: False
Notes:
The Triple Exponential Average (TRIX) indicator is an oscillator used
to identify oversold and overbought markets and it can also be used
as a momentum indicator. As is common with many oscillators, TRIX
oscillates around a zero line. When used as an oscillator, a positive
value indicates an overbought market while a negative value indicates
an oversold market. As a momentum indicator, a positive value suggests
momentum is increasing while a negative value suggests momentum is
decreasing.
Download File:
TripleExponentialAverage.efs
EFS Code:
PHP Code:
/*********************************

Provided By:

    eSignal (Copyright c eSignal), a division of Interactive Data

    Corporation. 2008. All rights reserved. This sample eSignal

    Formula Script (EFS) is for educational purposes only and may be

    modified and saved under a new file name.  eSignal is not responsible

    for the functionality once modified.  eSignal reserves the right

    to modify and overwrite this EFS file with each new release.


Description:

    Triple Exponential Average


Version:            1.0  08/08/2008


Notes:

    The Triple Exponential Average (TRIX) indicator is an oscillator used

    to identify oversold and overbought markets and it can also be used

    as a momentum indicator. As is common with many oscillators, TRIX

    oscillates around a zero line. When used as an oscillator, a positive

    value indicates an overbought market while a negative value indicates

    an oversold market. As a momentum indicator, a positive value suggests

    momentum is increasing while a negative value suggests momentum is

    decreasing.


Formula Parameters:                     Default:

    * Color line null                    Green

    * Length                               9

    * Gradient Color                      200

    * Display Title Value                False

**********************************/


var fpArray = new Array();

var bInit = false;

var myTRIX = null;

var Max = 1;

var Min = -1;


function preMain() {


    setPriceStudy(false);

    setShowCursorLabel(false);

    setShowTitleParameters( false );


    setStudyTitle("Triple Exponential Average");

    setCursorLabelName("TRIX", 0);

    setCursorLabelName("NULL", 1);


    setDefaultBarFgColor(Color.blue, 0);

    setDefaultBarFgColor(Color.green, 1);

    setPlotType(PLOTTYPE_LINE, 0);

    setPlotType(PLOTTYPE_LINE, 1);


    setDefaultBarThickness(1, 0);

    setDefaultBarThickness(1, 1);


    askForInput();

    var x=0;

    fpArray[x] = new FunctionParameter("LineColor", FunctionParameter.COLOR);

    with(fpArray[x++]){

        setName("Color line null");

        setDefault(Color.green);

    }


    fpArray[x] = new FunctionParameter("Length", FunctionParameter.NUMBER);

    with(fpArray[x++]){

        setLowerLimit(1);

        setDefault(9);

    }


    fpArray[x] = new FunctionParameter("ViewValue", FunctionParameter.BOOLEAN);

    with(fpArray[x++]){

       setName("Display Title Value");

       setDefault(false);

    }


    fpArray[x] = new FunctionParameter("GradientColor", FunctionParameter.NUMBER);

    with(fpArray[x++]){

       setName("Color Gradient");

        addOption(0);

        addOption(50);

        addOption(100);

        addOption(150);

        addOption(200);

        addOption(250);

        setDefault(200);

    }

}


function main(LineColor, ViewValue, Length, GradientColor) {

var nmyTRIX;

var nmyTRIX2;

var Rez;

var inc;


   if(getCurrentBarCount() < Length) return;


   if ( bInit == false ) {

      myTRIX = efsInternal("TRIXLog", close(), Length);

      myTRIX = ema(Length, myTRIX);

      myTRIX = ema(Length, myTRIX);

      myTRIX = ema(Length, myTRIX);

      setDefaultBarFgColor(LineColor, 1);

      bInit = true;

   }


   nmyTRIX = myTRIX.getValue(0);

   nmyTRIX2 = myTRIX.getValue(-1);


   if (nmyTRIX2 == null) nmyTRIX2 = 0;


   Rez = (nmyTRIX - nmyTRIX2) * 10000 ;

   inc = Math.round(Rez);

   if (inc > Max) Max = inc;

   if (inc < Min) Min = inc;


   inc = RGB_G(inc, Max, Min);

   if (inc == null) inc = 0;


   setDefaultBarFgColor(Color.RGB(GradientColor,inc,0),0);


   return new Array (Rez, 0);


}


function TRIXLog(DataArray, Length) {

var tmp;

  tmp = DataArray.getValue(0);

  return (Math.log(tmp));

}


function RGB_G(Val, Max, Min) {

var tmpG = 0;

var Perc1 = 0;

 if (Val > 0) {

    Perc1 = (Val * 100) / Max;

    tmpG = 255 - (Perc1*255)/100;

    return Math.round(tmpG);

 } else {

    Perc1 = ((Val*-1) * 100) / (Min*-1);

    tmpG = 255 - (Perc1*255)/100;

    return Math.round(tmpG);

 }

 return  tmpG;

}