 Tweet
Tweet
File Name: D_ELI.efs
Description:
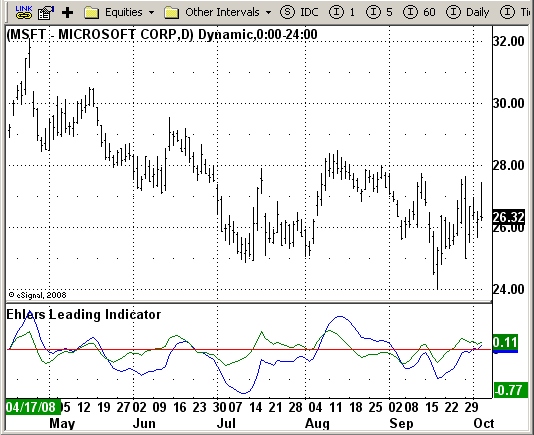
D - ELI (Ehlers Leading Indicator)
Formula Parameters:
Length: 7
Notes:
TradeStation does not allow the user to make a Multi Data Chart with a
Tick Bar Chart and any other type a chart. This Indicator plots a single
Daily DSP (Detrended Synthetic Price) and a Daily ELI (Ehlers Leading
Indicator) using intraday data.
Detrended Synthetic Price is a function that is in phase with the dominant
cycle of real price data. This one is computed by subtracting a 3 pole Butterworth
filter from a 2 Pole Butterworth filter. Ehlers Leading Indicator gives an advanced
indication of a cyclic turning point. It is computed by subtracting the simple
moving average of the detrended synthetic price from the detrended synthetic price.
Buy and Sell signals arise when the ELI indicator crosses over or under the detrended
synthetic price.
See "MESA and Trading Market Cycles" by John Ehlers pages 64 - 70.
Download File:
D_ELI.efs
EFS Code:
Description:
D - ELI (Ehlers Leading Indicator)
Formula Parameters:
Length: 7
Notes:
TradeStation does not allow the user to make a Multi Data Chart with a
Tick Bar Chart and any other type a chart. This Indicator plots a single
Daily DSP (Detrended Synthetic Price) and a Daily ELI (Ehlers Leading
Indicator) using intraday data.
Detrended Synthetic Price is a function that is in phase with the dominant
cycle of real price data. This one is computed by subtracting a 3 pole Butterworth
filter from a 2 Pole Butterworth filter. Ehlers Leading Indicator gives an advanced
indication of a cyclic turning point. It is computed by subtracting the simple
moving average of the detrended synthetic price from the detrended synthetic price.
Buy and Sell signals arise when the ELI indicator crosses over or under the detrended
synthetic price.
See "MESA and Trading Market Cycles" by John Ehlers pages 64 - 70.
Download File:
D_ELI.efs
EFS Code:
PHP Code:
/*********************************

Provided By:

    eSignal (Copyright c eSignal), a division of Interactive Data

    Corporation. 2008. All rights reserved. This sample eSignal

    Formula Script (EFS) is for educational purposes only and may be

    modified and saved under a new file name.  eSignal is not responsible

    for the functionality once modified.  eSignal reserves the right

    to modify and overwrite this EFS file with each new release.


Description:

    D_ELI (Ehlers Leading Indicator)


Version:            1.0  09/25/2008


Notes:


    TradeStation does not allow the user to make a Multi Data Chart with a

    Tick Bar Chart and any other type a chart. This Indicator plots a single

    Daily DSP (Detrended Synthetic Price) and a Daily ELI (Ehlers Leading

    Indicator) using intraday data.

    Detrended Synthetic Price is a function that is in phase with the dominant

    cycle of real price data. This one is computed by subtracting a 3 pole Butterworth

    filter from a 2 Pole Butterworth filter. Ehlers Leading Indicator gives an advanced

    indication of a cyclic turning point. It is computed by subtracting the simple

    moving average of the detrended synthetic price from the detrended synthetic price.

    Buy and Sell signals arise when the ELI indicator crosses over or under the detrended

    synthetic price.

    See "MESA and Trading Market Cycles" by John Ehlers pages 64 - 70.


Formula Parameters:                     Default:

    Length                                  7


**********************************/


var fpArray = new Array();

var bInit = false;


function preMain()

{


    setPriceStudy(false);

    setStudyTitle("Ehlers Leading Indicator");

    setCursorLabelName("D-DSP", 0);

    setCursorLabelName("D_ELI", 1);

    setDefaultBarFgColor(Color.blue, 0);

    setDefaultBarFgColor(Color.green, 1);

    addBand(0, PS_SOLID, 1, Color.red);


    var x=0;

    fpArray[x] = new FunctionParameter("Length", FunctionParameter.NUMBER);

    with(fpArray[x++]){

        setLowerLimit(1);

        setDefault(7);

    }

}


var xSeries = null;

var xEMA1 = null;

var xEMA2 = null;

var xEMA1_EMA2 = null;

var xResultEMA = null;

var xHL2 = null;


function main(Length) {

var nState = getBarState();

var nBarCount = getCurrentBarCount();

var nEMA1_EMA2 = 0;

var nEMAResult = 0;


    if (nState == BARSTATE_ALLBARS) {

        if (Length == null) Length = 7;

    }


    if (bInit == false) {

        xHL2 = hl2(inv("d"));

        xEMA1 = ema(Length, xHL2);

        xEMA2 = ema(2 * Length + 1, xHL2);

        xEMA1_EMA2 = efsInternal("CalcEMAs", xEMA1, xEMA2);

        xResultEMA = ema(Length, xEMA1_EMA2);

        bInit = true;

    }


    if(nBarCount < Length * 4) return;


    nEMA1_EMA2 = xEMA1_EMA2.getValue(0);


    nEMAResult = xEMA1_EMA2.getValue(0) - xResultEMA.getValue(0);


    return new Array(nEMA1_EMA2, nEMAResult);

}


function CalcEMAs(xEMA1, xEMA2){

var nRes = 0;

    nRes = xEMA1.getValue(0) - xEMA2.getValue(0);

    if (nRes == null) nRes = 1;

    return nRes;

}