 Tweet
Tweet
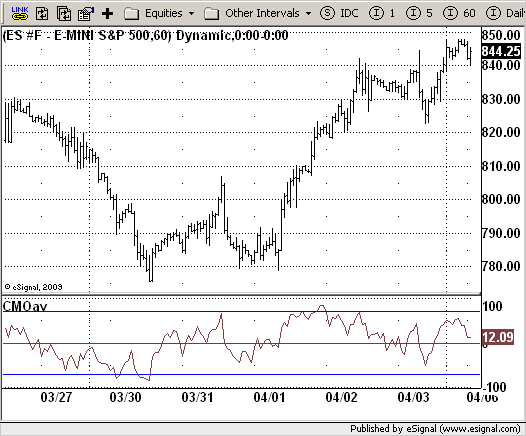
File Name: CMOav.efs
Description:
CMOav
Formula Parameters:
Length1 : 5
Length2 : 10
Length3 : 20
TopBand : 70
LowBand : -70
Notes:
This indicator plots average of three different length CMO's. This indicator
was developed by Tushar Chande. A scientist, an inventor, and a respected
trading system developer, Mr. Chande developed the CMO to capture what he
calls "pure momentum". For more definitive information on the CMO and other
indicators we recommend the book The New Technical Trader by Tushar Chande
and Stanley Kroll.
The CMO is closely related to, yet unique from, other momentum oriented
indicators such as Relative Strength Index, Stochastic, Rate-of-Change, etc.
It is most closely related to Welles Wilder`s RSI, yet it differs in several ways:
- It uses data for both up days and down days in the numerator, thereby directly
measuring momentum;
- The calculations are applied on unsmoothed data. Therefore, short-term extreme
movements in price are not hidden. Once calculated, smoothing can be applied to
the CMO, if desired;
- The scale is bounded between +100 and -100, thereby allowing you to clearly see
changes in net momentum using the 0 level. The bounded scale also allows you to
conveniently compare values across different securities.
Download File:
CMOav.efs
EFS Code:
PHP Code:
/*********************************

Provided By:

    eSignal (Copyright c eSignal), a division of Interactive Data

    Corporation. 2009. All rights reserved. This sample eSignal

    Formula Script (EFS) is for educational purposes only and may be

    modified and saved under a new file name.  eSignal is not responsible

    for the functionality once modified.  eSignal reserves the right

    to modify and overwrite this EFS file with each new release.


Description:

    CMOav


Version:            1.0  03/31/2009


Formula Parameters:                     Default:

    Length1                             5

    Length2                             10

    Length3                             20

    TopBand                             70

    LowBand                             -70


Notes:

    This indicator plots average of three different length CMO's. This indicator

    was developed by Tushar Chande. A scientist, an inventor, and a respected

    trading system developer, Mr. Chande developed the CMO to capture what he

    calls "pure momentum". For more definitive information on the CMO and other

    indicators we recommend the book The New Technical Trader by Tushar Chande

    and Stanley Kroll.

    The CMO is closely related to, yet unique from, other momentum oriented

    indicators such as Relative Strength Index, Stochastic, Rate-of-Change, etc.

    It is most closely related to Welles Wilder`s RSI, yet it differs in several ways:

    - It uses data for both up days and down days in the numerator, thereby directly

    measuring momentum;

    - The calculations are applied on unsmoothed data. Therefore, short-term extreme

    movements in price are not hidden. Once calculated, smoothing can be applied to

    the CMO, if desired;

    - The scale is bounded between +100 and -100, thereby allowing you to clearly see

    changes in net momentum using the 0 level. The bounded scale also allows you to

    conveniently compare values across different securities.

**********************************/


var fpArray = new Array();

var bInit = false;


function preMain() {

    setPriceStudy(false);

    setStudyTitle("CMOav");

    setCursorLabelName("CMOav", 0);

    setDefaultBarFgColor(Color.brown, 0);

    setStudyMax(101);

    setStudyMin(-101);

    var x = 0;

    fpArray[x] = new FunctionParameter("Length1", FunctionParameter.NUMBER);

    with(fpArray[x++]) {

        setLowerLimit(1);

        setDefault(5);

    }

    fpArray[x] = new FunctionParameter("Length2", FunctionParameter.NUMBER);

    with(fpArray[x++]) {

        setLowerLimit(1);

        setDefault(10);

    }

    fpArray[x] = new FunctionParameter("Length3", FunctionParameter.NUMBER);

    with(fpArray[x++]) {

        setLowerLimit(1);

        setDefault(20);

    }

    fpArray[x] = new FunctionParameter("TopBand", FunctionParameter.NUMBER);

    with(fpArray[x++]) {

        setLowerLimit(1);

        setDefault(70);

    }

    fpArray[x] = new FunctionParameter("LowBand", FunctionParameter.NUMBER);

    with(fpArray[x++]) {

        setLowerLimit(-101);

        setDefault(-70);

    }

}


var xCMOav = null;


function main(Length1, Length2, Length3, TopBand, LowBand) {

    var nBarState = getBarState();

    if (nBarState == BARSTATE_ALLBARS) {

        if (Length1 == null) Length1 = 5;

        if (Length2 == null) Length2 = 10;

        if (Length3 == null) Length3 = 20;

        if (TopBand == null) TopBand = 70;

        if (LowBand == null) LowBand = -70;

    }


    if (bInit == false) {

        xCMOav = efsInternal("Calc_CMO", Length1, Length2, Length3);

        addBand(TopBand, PS_SOLID, 1, Color.blue, "TopBand");

        addBand(LowBand, PS_SOLID, 1, Color.blue, "LowBand");

        addBand(0, PS_SOLID, 1, Color.red, "ZeroLine");

        bInit = true;

    }


    nCMOav = xCMOav.getValue(0);

    if (nCMOav == null) {

        return;

    }

    return nCMOav;

}


var xSecondInit = false;

var xMOM = null;

var xMOMAbs = null;


function Calc_CMO(Length1, Length2, Length3) {

    var nRes = 0;

    var nMaxLen = 0;

    var i = 0;

    var nPrice = 0;

    var nPriceAbs = 0;

    var nSum1 = 0;

    var nSum2 = 0;

    var nSum3 = 0;

    var naSum1 = 0;

    var naSum2 = 0;

    var naSum3 = 0;

    if (xSecondInit == false) {

        xMOM = efsInternal("Calc_Price");

        xMOMAbs = getSeries(xMOM, 1);

        xSecondInit = true

    }

    nMaxLen = Math.max(Length1, Length2);

    nMaxLen = Math.max(nMaxLen, Length3);

    for (i = 0; i < nMaxLen; i++) {

        nPrice = xMOM.getValue( -i);

        nPriceAbs = xMOMAbs.getValue( -i);

        if (i < Length1) {

            nSum1 += nPrice;

            naSum1 += nPriceAbs;

        }

        if (i < Length2) {

            nSum2 += nPrice;

            naSum2 += nPriceAbs;

        }

        if (i < Length3) {

            nSum3 += nPrice;

            naSum3 += nPriceAbs;

        }

    }

    nRes = 100 * (nSum1 / naSum1 + nSum2 / naSum2 + nSum3 / naSum3) / 3;

    if (nRes == null) {

        return;

    }

    return nRes;

}


var yMOM = null;


function Calc_Price() {

    var nPrice = 0;

    if (yMOM == null) {

        yMOM = mom(1);

    }

    nPrice = yMOM.getValue(0);

    return new Array(nPrice, Math.abs(nPrice));

}