 Tweet
Tweet
File Name: d3_10osc.efs
Description:
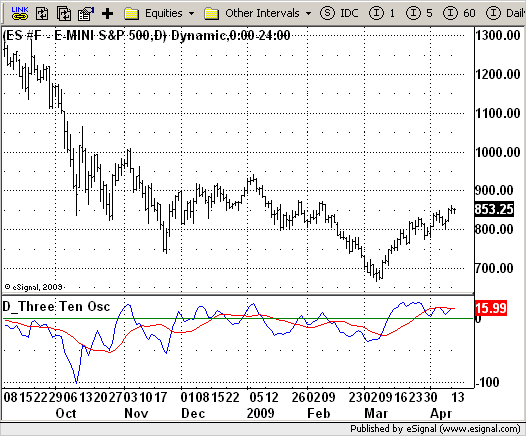
D_Three Ten Osc
Formula Parameters:
EMA Length 1 : 5
EMA Length 2 : 12
EMA Length 3 : 18
Notes:
This indicator allows the user to plot a daily 3-10 Oscillator
on a Tick Bar Chart or any intraday interval.
Walter Bressert's 3-10 Oscillator is a detrending oscillator derived
from subtracting a 10 day moving average from a 3 day moving average.
The second plot is an 16 day simple moving average of the 3-10 Oscillator.
The 16 period moving average is the slow line and the 3/10 oscillator is
the fast line.
For more information on the 3-10 Oscillator see Walter Bressert's book
"The Power of Oscillator/Cycle Combinations"
Download File:
d3_10osc.efs
EFS Code:
Description:
D_Three Ten Osc
Formula Parameters:
EMA Length 1 : 5
EMA Length 2 : 12
EMA Length 3 : 18
Notes:
This indicator allows the user to plot a daily 3-10 Oscillator
on a Tick Bar Chart or any intraday interval.
Walter Bressert's 3-10 Oscillator is a detrending oscillator derived
from subtracting a 10 day moving average from a 3 day moving average.
The second plot is an 16 day simple moving average of the 3-10 Oscillator.
The 16 period moving average is the slow line and the 3/10 oscillator is
the fast line.
For more information on the 3-10 Oscillator see Walter Bressert's book
"The Power of Oscillator/Cycle Combinations"
Download File:
d3_10osc.efs
EFS Code:
PHP Code:
/*********************************

Provided By:

    eSignal (Copyright c eSignal), a division of Interactive Data

    Corporation. 2009. All rights reserved. This sample eSignal

    Formula Script (EFS) is for educational purposes only and may be

    modified and saved under a new file name.  eSignal is not responsible

    for the functionality once modified.  eSignal reserves the right

    to modify and overwrite this EFS file with each new release.


Description:

    D_Three Ten Osc


Version:            1.0  04/10/2009


Formula Parameters:                     Default:

    EMA Length 1                        5

    EMA Length 2                        12

    EMA Length 3                        18


Notes:

    This indicator allows the user to plot a daily 3-10 Oscillator

    on a Tick Bar Chart or any intraday interval.

    Walter Bressert's 3-10 Oscillator is a detrending oscillator derived

    from subtracting a 10 day moving average from a 3 day moving average.

    The second plot is an 16 day simple moving average of the 3-10 Oscillator.

    The 16 period moving average is the slow line and the 3/10 oscillator is

    the fast line.

    For more information on the 3-10 Oscillator see Walter Bressert's book

    "The Power of Oscillator/Cycle Combinations"

**********************************/

var fpArray = new Array();

var bInit = false;


function preMain() {

    setStudyTitle("D_Three Ten Osc");

    setCursorLabelName("D_3-10", 0);

    setCursorLabelName("D_Ave", 1);

    setDefaultBarFgColor(Color.blue, 0);

    setDefaultBarFgColor(Color.red, 1);

    var x = 0;

    fpArray[x] = new FunctionParameter("nLength1", FunctionParameter.NUMBER);

    with(fpArray[x++]) {

        setName("EMA Length 1")

        setLowerLimit(1);

        setDefault(3);

    }

    fpArray[x] = new FunctionParameter("nLength2", FunctionParameter.NUMBER);

    with(fpArray[x++]) {

        setName("EMA Length 2")

        setLowerLimit(1);

        setDefault(10);

    }

    fpArray[x] = new FunctionParameter("nLength3", FunctionParameter.NUMBER);

    with(fpArray[x++]) {

        setName("SMA Length 3")

        setLowerLimit(1);

        setDefault(16);

    }

}


var xOsc = null;

var xSignal = null;


function main(nLength1, nLength2, nLength3) {


    if (bInit == false) {

        addBand(0, PS_SOLID, 1, Color.green, 0);

        if(isDWM()) var Interval = getInterval()+""; else var Interval = "d";

        xOsc = getSeries(macd( nLength1, nLength2, 1, hl2(inv(Interval))));

        xSignal = getSeries(sma(nLength3, xOsc));

        bInit = true;

    }


    return new Array (xOsc, xSignal);

}