 Tweet
Tweet
File Name: ProjectionOsc.efs
Description:
Projection Oscillator
Formula Parameters:
Length : 14
Smoothing : 3
Notes:
Projection bands, a new method using trading bands, projects market data
forward along the data trend with the maxima and minima of the projections
defining the band. The method provides another means of signaling potential
changes for market direction relative to the trend.
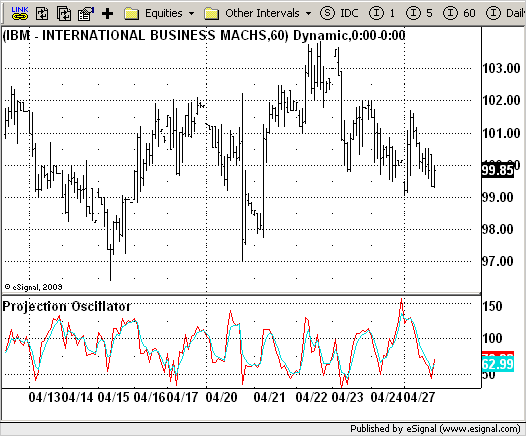
This is the second component of this method, the Projection Oscillator indicator.
In fact, the projection oscillator might be thought of as being analogous to the
stochastics indicator with a trend correction.
This indicator is calculated according to the next formula:
POC = 100 x (C - PLC) / (PUC - PLC)
Actually this indicator plots 2 indicators: Projection Oscillator itself and smoothed
Projection Oscillator, which is simply the n day exponential moving average (EMA) of
Projection oscillator
Download File:
ProjectionOsc.efs
EFS Code:
Description:
Projection Oscillator
Formula Parameters:
Length : 14
Smoothing : 3
Notes:
Projection bands, a new method using trading bands, projects market data
forward along the data trend with the maxima and minima of the projections
defining the band. The method provides another means of signaling potential
changes for market direction relative to the trend.
This is the second component of this method, the Projection Oscillator indicator.
In fact, the projection oscillator might be thought of as being analogous to the
stochastics indicator with a trend correction.
This indicator is calculated according to the next formula:
POC = 100 x (C - PLC) / (PUC - PLC)
Actually this indicator plots 2 indicators: Projection Oscillator itself and smoothed
Projection Oscillator, which is simply the n day exponential moving average (EMA) of
Projection oscillator
Download File:
ProjectionOsc.efs
EFS Code:
PHP Code:
/*********************************

Provided By:

    eSignal (Copyright c eSignal), a division of Interactive Data

    Corporation. 2009. All rights reserved. This sample eSignal

    Formula Script (EFS) is for educational purposes only and may be

    modified and saved under a new file name.  eSignal is not responsible

    for the functionality once modified.  eSignal reserves the right

    to modify and overwrite this EFS file with each new release.


Description:

    Projection Oscillator


Version:            1.0  04/27/2009


Formula Parameters:                     Default:

    Length                              14

    Smoothing                           3


Notes:

    Projection bands, a new method using trading bands, projects market data

    forward along the data trend with the maxima and minima of the projections

    defining the band. The method provides another means of signaling potential

    changes for market direction relative to the trend.

    This is the second component of this method, the Projection Oscillator indicator.

    In fact, the projection oscillator might be thought of as being analogous to the

    stochastics indicator with a trend correction.

    This indicator is calculated according to the next formula:

    POC = 100 x (C - PLC) / (PUC - PLC)

    Actually this indicator plots 2 indicators: Projection Oscillator itself and smoothed

    Projection Oscillator, which is simply the n day exponential moving average (EMA) of

    Projection oscillator


**********************************/

var fpArray = new Array();

var bInit = false;


function preMain() {

    setStudyTitle("Projection Oscillator");

    setCursorLabelName("PO", 0);

    setCursorLabelName("SlowPO", 1);

    setDefaultBarFgColor(Color.red, 0);

    setDefaultBarFgColor(Color.aqua, 1);

    var x = 0;

    fpArray[x] = new FunctionParameter("Length", FunctionParameter.NUMBER);

    with(fpArray[x++]) {

        setLowerLimit(1);

        setDefault(14);

    }

    fpArray[x] = new FunctionParameter("Smoothing", FunctionParameter.NUMBER);

    with(fpArray[x++]) {

        setLowerLimit(1);

        setDefault(3);

    }

}


var xPOC = null;

var xSlowPO = null;


function main(Length, Smoothing) {

    var nBarState = getBarState();

    if (nBarState == BARSTATE_ALLBARS) {

        if (Length == null) Length = 14;

        if (Smoothing == null) Smoothing = 3;

    }

    if (bInit == false) {

        xPOC = efsInternal("Calc_Value", Length);

        xSlowPO = ema(Smoothing, xPOC);

        bInit = true;

    }

    var PO = xPOC.getValue(0);

    var SlowPO = xSlowPO.getValue(0);

    if (SlowPO == null) return;

    return new Array(PO, SlowPO);

}


var bSecondInit = false;

var xHigh = null;

var xLow = null;


function Calc_Value(Length) {

    var SL = 0;


    var SH = 0;

    var Sum1_1 = 0;

    var Sum1_2 = 0;

    var SumY1 = 0;

    var SumY2 = 0;

    var i = 0;

    var Value2 = 0;

    var Value3 = 0;

    var PL = 0;

    var PU = 0;

    var SlowPO = 0;

    if (bSecondInit == false) {

        xHigh = high();

        xLow = low();

        bSecondInit = true;

    }

    if (xHigh.getValue(-Length) == null) return;

    var SumBars = Length * (Length - 1) * .5;

    var SumSqrBars = (Length - 1) * Length * (2 * Length - 1) / 6;

    for (i = 0; i < Length; i++) {

        Sum1_1 += i * xLow.getValue( - i);

        Sum1_2 += i * xHigh.getValue( - i);

        SumY1 += xLow.getValue( - i);

        SumY2 += xHigh.getValue( - i);

    }

    var Sum2_1 = SumBars * SumY1;

    var Sum2_2 = SumBars * SumY2;

    var Num1_1 = Length * Sum1_1 - Sum2_1;

    var Num1_2 = Length * Sum1_2 - Sum2_2;

    var Num2 = SumBars * SumBars - Length * SumSqrBars;

    SL = Num1_1 / Num2;

    SH = Num1_2 / Num2;

    for (i = 1; i <= Length; i++) {

        Value2 = xLow.getValue( - (i - 1)) + (SL * i - 1);

        Value3 = xHigh.getValue( - (i - 1)) + (SH * i - 1);

        if (i == 1) {

            PL = Value2;

            PU = Value3;

        }

        if (Value2 < PL) PL = Value2;

        if (Value3 > PU) PU = Value3;

    }

    var PO = 100 * (close(0) - PL) / (PU - PL);

    return PO;

}