 Tweet
Tweet
Hi,
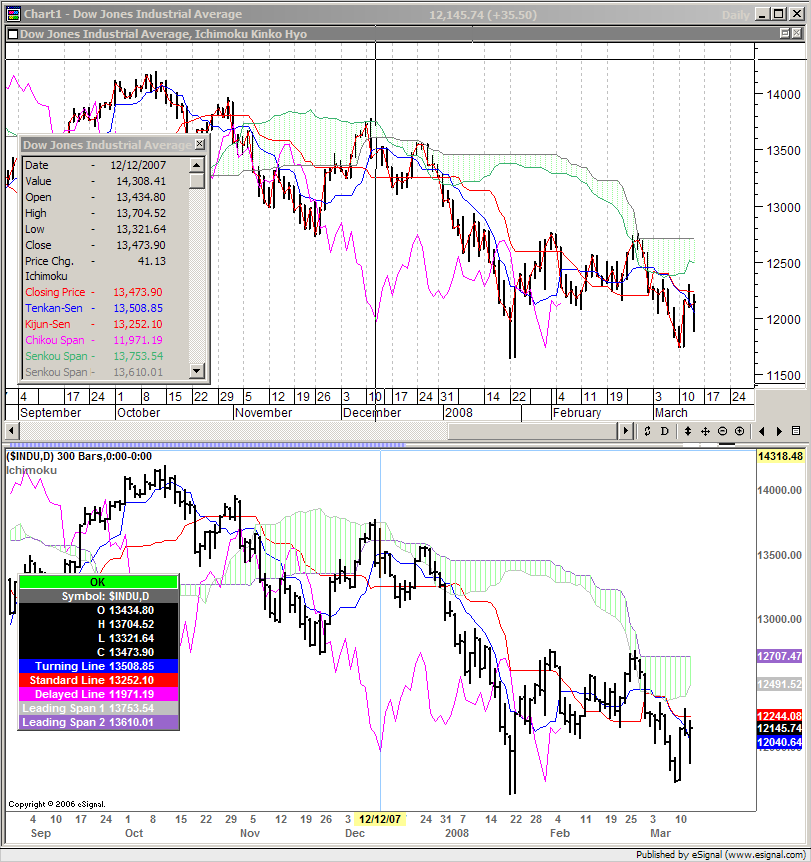
I have the efs study of Ichimoku charts up ... but..
it does not show the chart correctly....at least as I understand that it should be displayed.
The "CLOUD" should be shown displaced forward of price by 26 periods.
In my charts it just shows the Cloud as even with the price.
The many chart examples I have seen in books -
show the Cloud as displace forward (as is correct).
I'd like to get mine to do the same.
I don't know zip about EFS, or how to change it....
Help would be appreciated.
Comment