 Tweet
Tweet
Hello All,
Is anybody aware of an overlay or indicator that I can overlay on a tick/range-based chart to show volume/number of bars printing over a set period?
In other words, using today (NFP) as an example. This morning, in the lead up to the news on EURAUD and using a 3 Pip Range Bar we see 357 Bars Form in the period.
However, in the short time since the news at 13:30, we have seen 469 bars form to 15:00.
Is there a market profile I can load over this that shows higher and lower formation of tick/bars withouth having to measure them. In other words, I can see low-activity areas and high activity areas. Some kind of histogram or something that colours at certain levels?
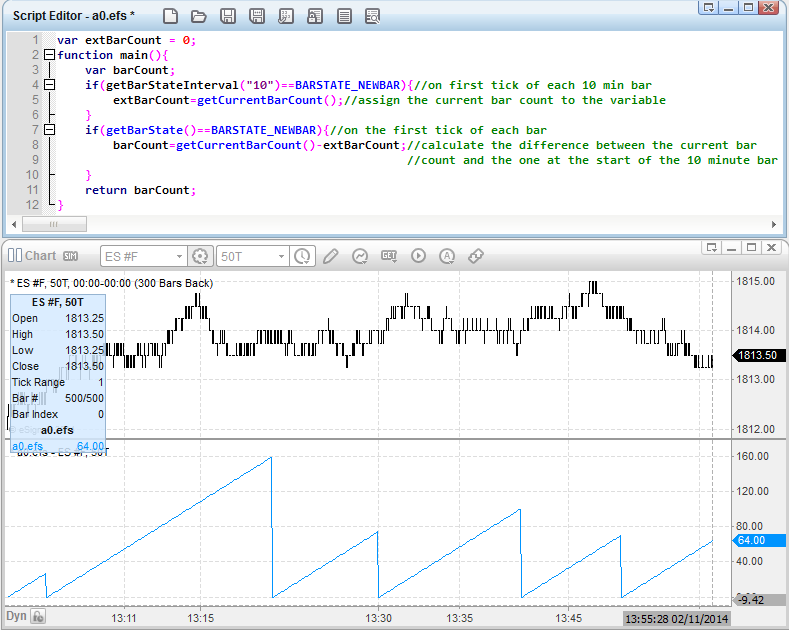
[EDIT] - In a simpler definition, how many bars are forming every 10 minutes/60 minutes for example? Bars Per Hour/Minute? Maybe expressed as a number?
Comments/Suggestions welcome as always, please see screen grab for actual display of the chart/proposal.
Thanks
HP
Is anybody aware of an overlay or indicator that I can overlay on a tick/range-based chart to show volume/number of bars printing over a set period?
In other words, using today (NFP) as an example. This morning, in the lead up to the news on EURAUD and using a 3 Pip Range Bar we see 357 Bars Form in the period.
However, in the short time since the news at 13:30, we have seen 469 bars form to 15:00.
Is there a market profile I can load over this that shows higher and lower formation of tick/bars withouth having to measure them. In other words, I can see low-activity areas and high activity areas. Some kind of histogram or something that colours at certain levels?
[EDIT] - In a simpler definition, how many bars are forming every 10 minutes/60 minutes for example? Bars Per Hour/Minute? Maybe expressed as a number?
Comments/Suggestions welcome as always, please see screen grab for actual display of the chart/proposal.
Thanks
HP
Attached Files
Comment