 Tweet
Tweet
I am looking for a script that can plot isolation pivots. I have searched both google, eSignal, and the eSignal forums and have been unable to find such an indicator.
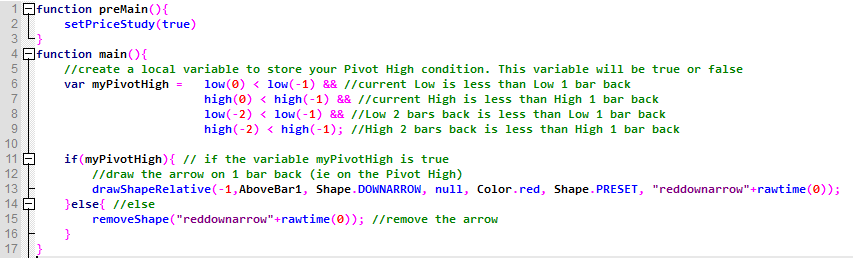
For me, an isolation pivot high is defined by the two bars or candles on either side of it. If the bars on either side of the bar in question have lower highs and lower lows than the center candle, then a down arrow or marker would be placed above the center bar.
An isolation pivot low is the opposite; the bars on either side of the center bar have got a higher low and a higher high than the center bar and consequently an up arrow or marker is placed below the center bar.
The indicator would populate isolation pivot highs and lows in any time frame as the bars or candles completed themselves.
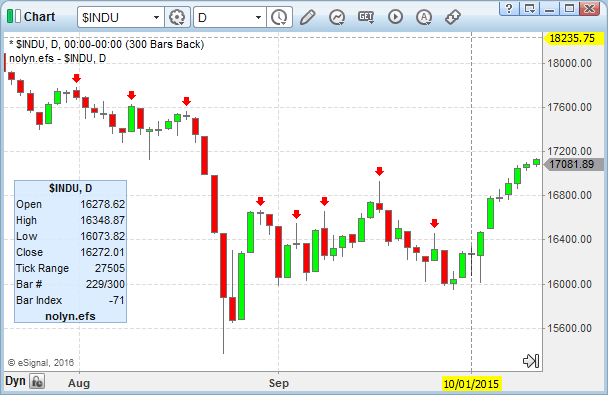
I have attached an image from a chart where I manually inserted the isolation pivot highs and lows to give an idea what I imagine they would look like.
If anyone knows of such a script for eSignal or knows how I could get it written, I'd very much appreciate it.
Thank you,
Nolyn
For me, an isolation pivot high is defined by the two bars or candles on either side of it. If the bars on either side of the bar in question have lower highs and lower lows than the center candle, then a down arrow or marker would be placed above the center bar.
An isolation pivot low is the opposite; the bars on either side of the center bar have got a higher low and a higher high than the center bar and consequently an up arrow or marker is placed below the center bar.
The indicator would populate isolation pivot highs and lows in any time frame as the bars or candles completed themselves.
I have attached an image from a chart where I manually inserted the isolation pivot highs and lows to give an idea what I imagine they would look like.
If anyone knows of such a script for eSignal or knows how I could get it written, I'd very much appreciate it.
Thank you,
Nolyn
Attached Files
Comment