Announcement

Collapse
No announcement yet.

Basic tips for EFS

Collapse
This topic is closed.
X
X
 
  • Filter
  • Time
  • Show
Clear All
new posts

  • Basic tips for EFS

    The enclosed efs template can be used to create virtually any formula.
    All the most relevant and commonly used parts of a script are identified and commented. For detailed explanations on these parts and instructions on how to use them refer to the Guide to developing eSignal Indicators
    Copy of this template can also be downloaded from here

    PHP Code:
    //Alexis C. Montenegro © October 2005   
    /****************************** preMain function **************************************/
    function preMain(){
     
        
    setPriceStudy(true/false);//select if price (true) OR non-price (false) study
        
    setStudyTitle("");//add the study title
        
        //following statements define the default properties of the returned item
        
    setCursorLabelName("label name",0);//cursor window label name
        
    setDefaultBarFgColor(Color.blue,0);//plot color
        
    setPlotType(PLOTTYPE_LINE,0);//plot type
        
    setDefaultBarThickness(1,0);//plot thickness
        
        //if returning two items uncomment the following lines
        //setCursorLabelName("label name",1);
        //setDefaultBarFgColor(Color.red,1);
        //setPlotType(PLOTTYPE_LINE,1);
        //setDefaultBarThickness(1,1);
        
        //if returning more than two items add the required statements
        //setCursorLabelName("label name",2);
        //etc
        
        //if painting the price bars uncomment the following lines
        //setColorPriceBars(true);
        //setDefaultPriceBarColor(Color.black);
    }
    /******************************* end preMain function **********************************/
     
    /******* declare global variables here **********/
    //for example var myGlobalVar = null;
     

    /*********** end global variables ***************/
     
    /******************************* main function *****************************************/
    function main(){
     
        
    /************** declare local variables here ***********************/
        //for example var myLocalVar = 0;
        
        
        /****************** end local variables ****************************/
        
        /************ initialize global variables here *********************/
        //for example if(myGlobalVar==null) myGlobalVar = sma(10);
        
        
        /***************  end intialization variables **********************/
        
        /***************   insert your main code here   ********************/


        /*** if part of the code needs to be computed only on a new bar ****/
        /*** insert code inside the BARSTATE_NEWBAR condition           ****/
        
    if(getBarState()==BARSTATE_NEWBAR){
            
        }
        
    /******************* end BARSTATE_NEWBAR condition *****************/


        /********************* end main code here **************************/
        
        /******************  insert your return here ***********************/
        //if only one item use  return (myVar);
        //if more than one item use return new Array (myVar1, myVar2, etc);
        
        /********************** end return *********************************/
    }
    /******************************* end main function **************************************/ 

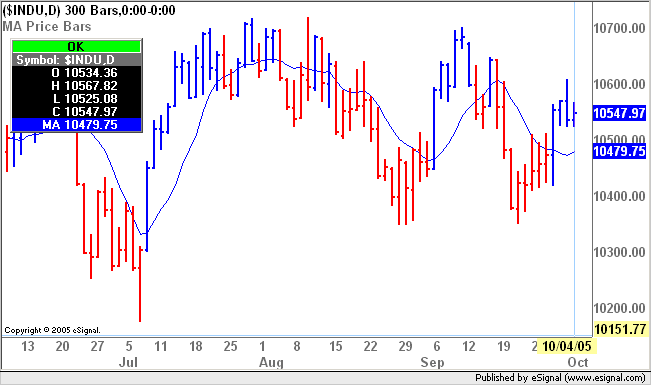
    Following is the same template set up as a complete formula. This efs uses a moving average to color the price bars in blue if the Close is above the average or in red if below. Results are shown in the image that follows the code.

    PHP Code:
    //Alexis C. Montenegro © October 2005   
    /****************************** preMain function **************************************/
    function preMain(){
     
        
    setPriceStudy(true);//select if price (true) OR non-price (false) study
        
    setStudyTitle("MA Price Bars");//add the study title
        
        //following statements define the default properties of the returned item
        
    setCursorLabelName("MA",0);//cursor window label name
        
    setDefaultBarFgColor(Color.blue,0);//plot color
        
    setPlotType(PLOTTYPE_LINE,0);//plot type
        
    setDefaultBarThickness(1,0);//plot thickness
        
        //if returning two items uncomment the following lines
        //setCursorLabelName("label name",1);
        //setDefaultBarFgColor(Color.red,1);
        //setPlotType(PLOTTYPE_LINE,1);
        //setDefaultBarThickness(1,1);
        
        //if returning more than two items add the required statements
        //setCursorLabelName("label name",2);
        //etc
        
        //if painting the price bars uncomment the following lines
        
    setColorPriceBars(true);
        
    setDefaultPriceBarColor(Color.black);
    }
    /******************************* end preMain function *********************************/
     
    /******* declare global variables here **********/
    //for example var myGlobalVar = null;
    var myStudy null;
     
    /*********** end global variables ***************/
     
    /******************************* main function ****************************************/
    function main(){
     
        
    /************** declare local variables here ***********************/
        //for example var myLocalVar = 0;
        
    var myMA 0;
        var 
    Close close(0);
        
        
    /****************** end local variables ****************************/
        
        /************ initialize global variables here *********************/
        //for example if(myGlobalVar==null) myGlobalVar = sma(10);
        
    if (myStudy == nullmyStudy sma(10);
        
        
    /***************  end intialization variables **********************/
        
        /***************   insert your main code here   ********************/
        
    myMA myStudy.getValue(0);
        
        if (
    myMA == null || Close == null) {
            return;
        }
     
        
    /*** if part of the code needs to be computed only on a new bar ****/
        /*** insert code inside the BARSTATE_NEWBAR condition           ****/
        
    if(getBarState()==BARSTATE_NEWBAR){
            
        }
        
    /******************* end BARSTATE_NEWBAR condition *****************/
        
        
    if (Close myMA){
            
    setPriceBarColor(Color.blue);
        } else if (
    Close myMA){
            
    setPriceBarColor(Color.red);
        }  


    /********************* end main code here **************************/
        
        /******************  insert your return here ***********************/
        //if only one item use  return (myVar);
        //if more than one item use return new Array (myVar1, myVar2, etc);
        
    return myMA;
        
    /********************** end return *********************************/
    }
    /******************************* end main function *************************************/ 

  • #2
    How to add user defined parameters to an efs

    Assume we have the following moving average efs

    PHP Code:
    function preMain(){
        
    setPriceStudy(true);
        
    setStudyTitle("Moving Average");
        
    setCursorLabelName("MA");
    }
     
    var 
    myAvg null;
     
    function 
    main(){
     
        if(
    myAvg==nullmyAvg sma(20);
     
        return 
    myAvg.getValue(0);

    At this point we would like to make the length of the moving average a user defined parameter which we will call Length. We have two solutions available.

    PHP Code:
    function preMain(){
        
    setPriceStudy(true);
        
    setStudyTitle("Moving Average");
        
    setCursorLabelName("MA");
    }
     
    var 
    myAvg null;
     
    function 
    main(Length){//add the parameter to the main definition
     
        //we now need to initialize the parameter variable
        
    if(Length==null){//if no value is assigned to Length
            
    Length 20;//then set Length to 20
        
    }
     
        if(
    myAvg==nullmyAvg sma(Length);//replace the value with the parameter variable
     
        
    return myAvg.getValue(0);

    For the second solution we instead use a Function Parameter

    PHP Code:
    function preMain(){
        
    setPriceStudy(true);
        
    setStudyTitle("Moving Average");
        
    setCursorLabelName("MA");
     
        var 
    fp1 = new FunctionParameter("Length"FunctionParameter.NUMBER);
        
    fp1.setName("Length of MA");
        
    fp1.setLowerLimit(1);
        
    fp1.setUpperLimit(200);
        
    fp1.setDefault(20);
    }
     
    var 
    myAvg null;
     
    function 
    main(Length){//add the parameter to the main definition
     
        
    if(myAvg==nullmyAvg sma(Length);//replace the value with the parameter variable
     
        
    return myAvg.getValue(0);

    While slightly more involved this solution offers several advantages. First we can assign a name to appear in Edit Studies that is different from that of the variable. Secondly we no longer need to initialize the variable because we set its default value in the Function Parameter. Also we can now see the default values in Edit Studies and lastly we can set upper and lower limits for the parameter.
    For detailed information and examples on the Function Parameter Class see this article in the EFS KnowledgeBase.
    Alex

    Comment


    • #3
      Syntax for EFS2 built-in studies

      Here are a few examples of the syntax required with EFS2 studies. Although I will be using the sma() [ie simple moving average] function the syntax is applicable to all built-in studies aside from the parameters that are specific to a study.

      This is the function in its most basic form
      sma(10)

      In most studies when no source is provided the implied source is the close() series. In fact the same command shown above could be written as follows and would return the same result
      sma(10, close())

      Replace close with high, low, hl2, etc to create a moving average of any of those price series.

      At this point let us assume that we want to base the average on the 5 minute data series of the close() The function will be now written as follows
      sma(10, inv(5))

      As you can see we just need to add the inv() function to which we pass the interval to call the 5 minute data series of the close(). The parameter for the inv() function can be a number or must be a string if the interval contains a letter (ie "150T", "W", etc)
      For the reason explained above we could also write this in the following way ie by defining a source to be used. In this case the inv() function will be nested inside the source
      sma(10, close(inv(5)))

      Replace close with high, low, hl2, etc to create a moving average of any of those price series.

      If instead of using an external interval we want to base the moving average on a different symbol we replace the inv() function with the sym() function. In this case the parameter ie the symbol is always a string.
      sma(10, sym("ibm"))

      As with the prior examples the same can be written as follows and you can replace close with high, low, hl2, etc. Also in this case the sym() function is nested inside the source series.
      sma(10, close(sym("ibm")))

      If instead we wanted to use both a different symbol and a different interval we would use the sym() function and use as the parameter a string which is a combination of the symbol and the interval separated by a comma ie sym("ibm,5")
      Following is the function in its simplest form ie where we don't specify the source as we imply that it is the close()
      sma(10, sym("ibm,5"))

      If we want to instead specify the source the sym() function will be nested in it as with prior examples
      sma(10, close(sym("ibm,5")))

      All the examples shown up to now will return a series. EFS2 also allows us to directly retrieve a single value from a series without necessarily having to use the getValue() method.
      In order to retrieve the value we use the barIndex parameter. Starting with the most basic function this is what we would do
      sma(10, -1)

      The second parameter ie -1 in this case indicates that we are retrieving the value of the moving average at the prior bar. If we wanted to retrieve the value of three bars ago we would replace -1 with -3 ie
      sma(10, -3)

      The bar index parameter can be applied to all the examples shown above. Here is the complete sequence based on the assumption that we want to retrieve the value of two bars ago (the barIndex parameter is shown in red)

      sma(10, close(), -2)

      sma(10, inv(5), -2)

      sma(10, close(inv(5)), -2)

      sma(10, sym("ibm"), -2)

      sma(10, close(sym("ibm")), -2)

      sma(10, sym("ibm,5"), -2)

      sma(10, close(sym("ibm,5")), -2)

      Note that when an external interval is used with either the inv() or sym() function the barIndex parameter refers to the bar of the external interval and not of the chart interval. Hence if we are plotting a 5 minute chart and we use sma(10, close(inv(60)),-1) the value we are retrieving is that of the average at the prior 60 minute bar and not that of the average on the prior 5 minute bar.

      To continue this series of examples we could assume that instead of a price series we want to use another study such as for example the RSI as the source. The overall logic does not change and all we need to do is nest the rsi() function inside the sma() function while passing to the rsi() function its parameters. Here is the study on study in its simplest form
      sma(10, rsi(14))

      If at this point we want to apply any of the source/symbol/interval combinations shown above all we need to do is consider that we need to nest them inside the rsi() function which is the innermost study. Here again is a complete sequence with a brief explanation next to each variation

      sma(10, rsi(14, close())) - simple average of the RSI of the Close series

      sma(10, rsi(14, inv(5))) - simple average of the RSI based on 5 minute [Close] series

      sma(10, rsi(14, close(inv(5)))) - simple average of the RSI based on 5 minute Close series

      sma(10, rsi(14, sym("ibm"))) - simple average of the RSI based on IBM [Close] series

      sma(10, rsi(14, close(sym("ibm")))) - simple average of the RSI based on IBM Close series

      sma(10, rsi(14, sym("ibm,5"))) - simple average of the RSI based on 5 minute [Close] of IBM series

      sma(10, rsi(14, close(sym("ibm,5")))) - simple average of the RSI based on 5 minute Close of IBM series

      Continuing with the examples let us assume that at this point we would like to create a Stochastic of this study on study. Once again the logic of the syntax does not change and all we need to do is nest inside the Stochastic function (ie stochK() or stochD()) the code that we have put together up to now. Note that the Stochastic functions have three parameters of their own eg stochK(lengthK, smoothK, lengthD)
      Starting from the simplest function here is the complete sequence of variations we have used up to now.

      stochK(14, 1, 1, sma(10, rsi(14)))

      stochK(14, 1, 1, sma(10, rsi(14, close())))

      stochK(14, 1, 1, sma(10, rsi(14, inv(5))))

      stochK(14, 1, 1, sma(10, rsi(14, close(inv(5)))))

      stochK(14, 1, 1, sma(10, rsi(14, sym("ibm"))))

      stochK(14, 1, 1, sma(10, rsi(14, close(sym("ibm")))))

      stochK(14, 1, 1, sma(10, rsi(14, sym("ibm,5"))))

      stochK(14, 1, 1, sma(10, rsi(14, close(sym("ibm,5")))))

      As with the prior examples you can replace close with the price series of your choice ie high, low, hl2, etc.

      In closing here are a couple of examples of nested studies on studies.
      This is an exponential average of a Stochastic%K of an exponential average of a Stochastic%K of the (High+Low)/2 price series based on 60 minute data.
      ema(3, stochK(5, 1, 1, ema(3, stochK(5, 1, 1, hl2(inv(60))))))

      The next one is a triple exponential average of the CCI based on the Close of the weekly data of IBM
      ema(3, ema(3, ema(3, cci(6, close(sym("IBM,W"))))))

      For more information on how to create your own custom studies that you can then use as the source for the builtin studies see this thread which will provide you with several examples.
      Alex

      Comment

      Working...
      X