Announcement

Collapse
No announcement yet.

Some simple scripts

Collapse
This topic is closed.
X
X
 
  • Filter
  • Time
  • Show
Clear All
new posts

  • Some simple scripts

    Here are two simple scripts that I have found to be quite useful.

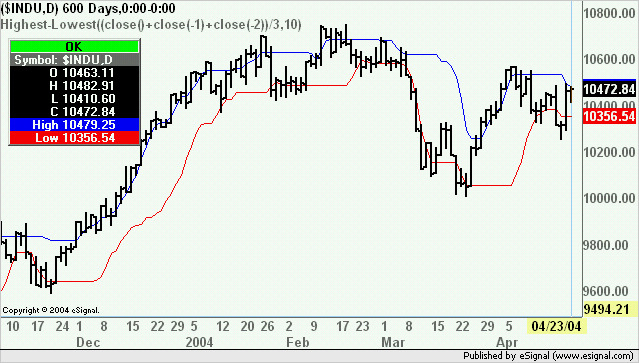
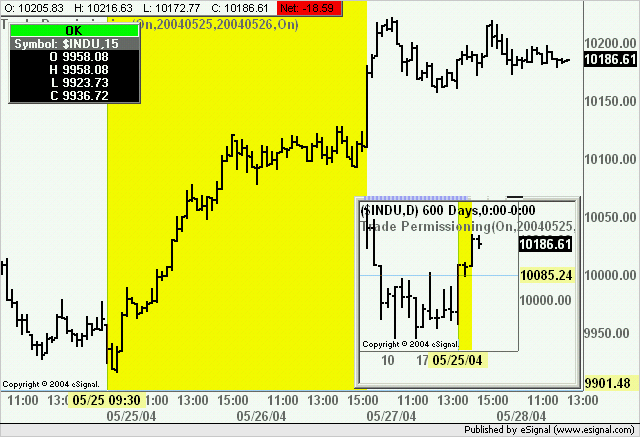
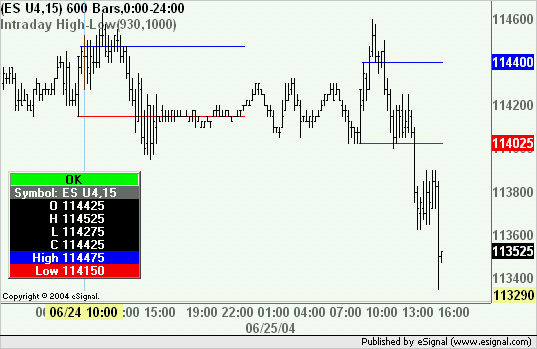
    The first one writes the OHLC values of the current bar at the bottom of the chart and is actually a revision of one I posted some time ago.
    That version though had some limitations as the values of OHLC were written on the chart in four distinct groups making it difficult to space them correctly for use with a variety of symbols.
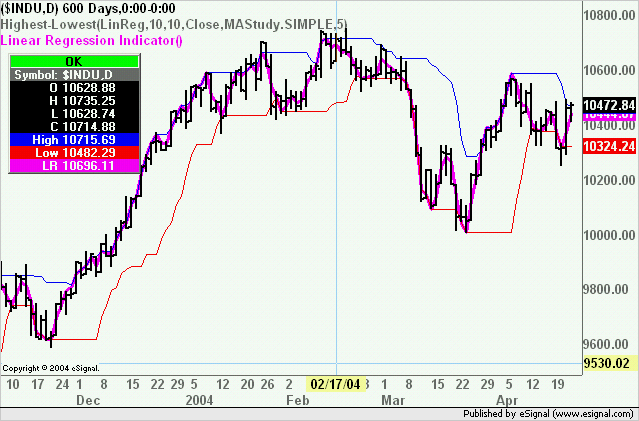
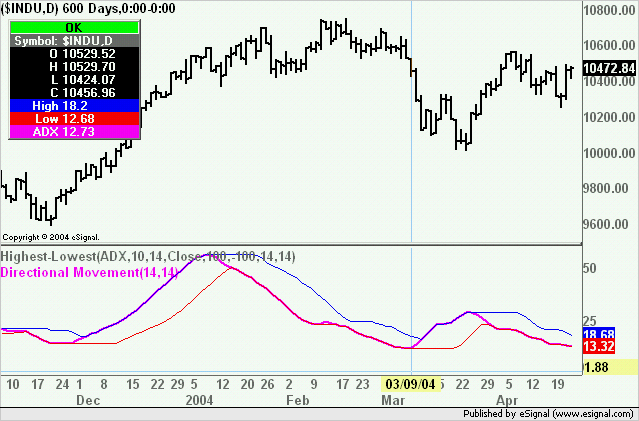
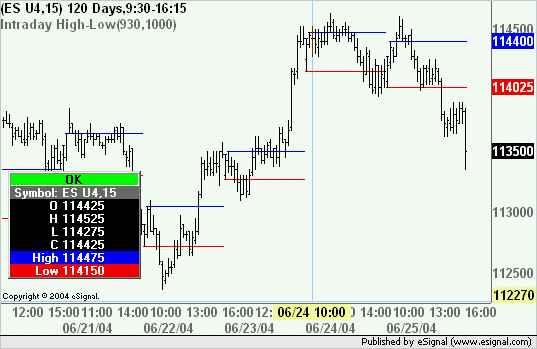
    I have modified the efs and now write all the values into a single group so that the OHLC values will always have the same spacing relative to each other irrespective of the number of integers or decimals.
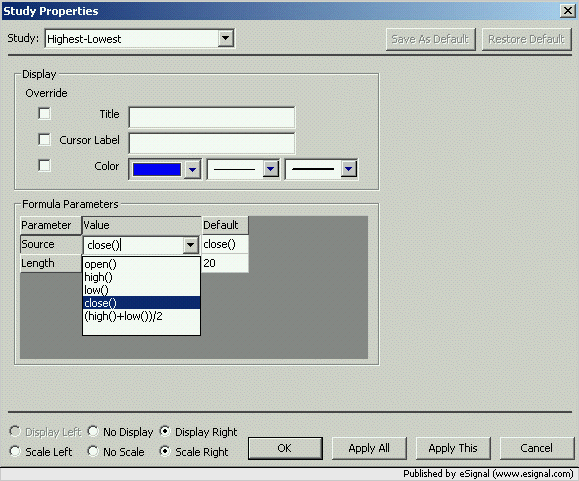
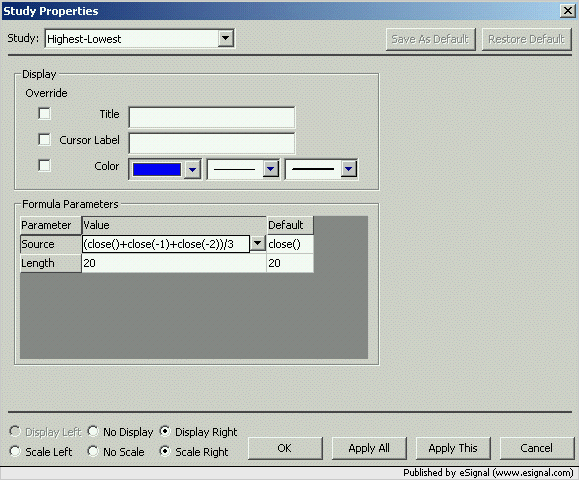
    I have now included a "Decimals" setting so that the efs can be easily adapted to the symbols used. This is set to show 2 decimals by default but can be changed through Edit Studies (the default can be changed by using Editor and modifying the value in Line 30).


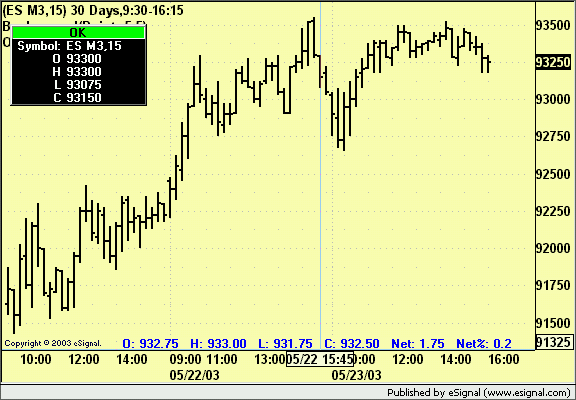
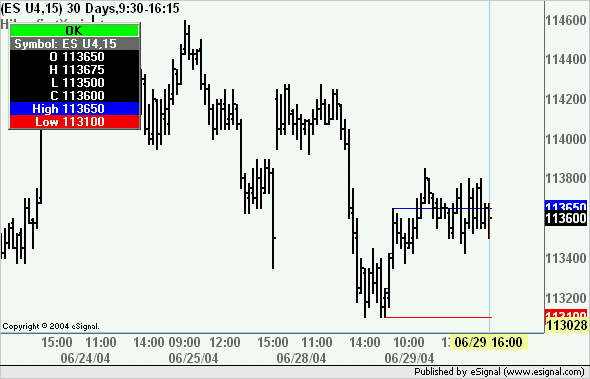
    I have also added two new fields ie Net and Net% which are calculated in the following way. If the chart is intraday or daily then the Net and Net% are based on the prior daily close, if the chart is weekly or higher then the Net and Net% are based on the corresponding prior period. This is particularly useful on higher intervals as there is no immediate way to see these values otherwise.
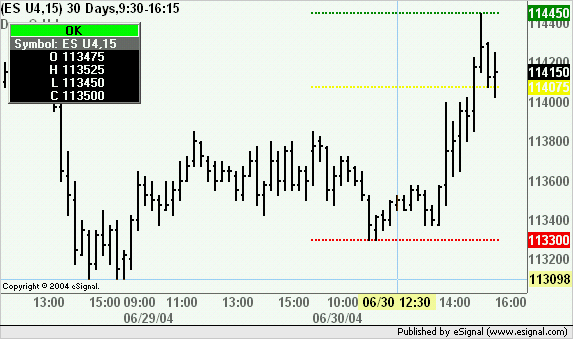
    The text will be colored in blue if the current close is higher than the previous daily close (if using intraday or daily charts) or the one of the prior period (if using weekly or higher) and will be colored red if lower (gray if unchanged).
    Lastly there is a setting in Edit Studies that will allow to shift the text position sideways. The default value is 25 and decreasing the number will shift the text to the left while increasing it will shift it to the right.
    Any of the 7.3 beta versions (or higher) are required to run this efs. Also required is getPrevOHLC.efs in the OHLC subfolder of the Formulas folder.
    Alex

    Note: A more recent version of this efs is available here.
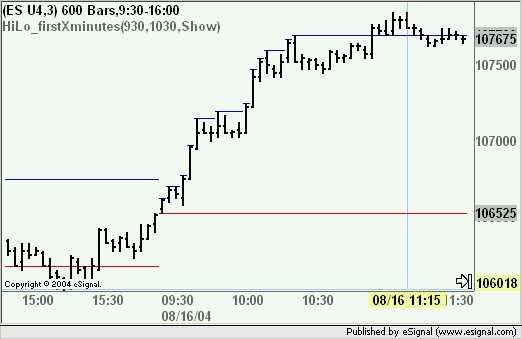
    Attached Files

  • #2
    Background

    The attached script colors the chart in green, yellow or red based upon the current price being above, at or below the prior period's close plus or minus a fixed point or percentage value.
    In the example below one can see three moments during the trading days of ES M3.


    If the chart is intraday or daily then the current price is computed against the prior day's close (plus or minus the threshold value), if the chart is weekly (or higher) then the current price is computed against the corresponding prior period (plus or minus the threshold value).
    The threshold value at which the chart colors in green or red is ±5 points by default and can be modified through Edit Studies. This value can be either a fixed point value to be added/subtracted from the prior period's close or a percentage and can be set independently for the upper and lower thresholds. The option to select point or percentage (default is Points) is also selectable in Edit Studies.
    If someone wants to modify the defaults full explanation and instructions are available in the efs itself.
    Versions 7.3 beta or higher are required to run this script. Also required is getPrevOHLC.efs in the OHLC subfolder of the Formulas folder.
    Alex
    Attached Files

    Comment


    • #3
      Thermometer

      This script replicates on an intraday chart the "Thermometer" that is in the Quote Board.


      Just like in the Quote Board the separation line between the red and green areas indicates the Last, the green area the Low-to-Last and the red area the High-to-Last.
      A blue triangle indicates the daily Open.

      WARNING: This efs requires that you have getTodayOHLC1.efs in the OHLC subfolder of the Formulas folder.
      getTodayOHLC1 is available at the following link
      http://share.esignal.com/groupconten...las&groupid=10
      This is a special version of the getTodayOHLC.efs that was programmed by JasonK to allow for multiple callFunctions such as the ones used in the Thermometer.efs.


      Alex
      Attached Files

      Comment


      • #4
        Given that there have been a number of requests in the past for a way to determine the highest and/or lowest value of a study (or an expression) and since the builtin Donchian Study cannot be used in a "Study on Study" I thought it might be useful to create an efs that could accomplish this task while being both flexible and easy to set up.

        In this first message the attached efs is set up as a basic template with a few simple price based variables already predefined. In the following two messages I will also provide a version to be used as a price study and one as a non price study both of which include some sample studies. Comments are included in all three efs(s)

        The attached efs is set up as a price study and uses the Close as the default variable. Other available predefined variables are High, Low, Close, (High+Low)/2 (see following image)


        In the image you can also see that there is an empty variable. This is set up so that the user can create simple expressions using Open, High, Low, Close even from past bars.
        The syntax for the OHLC values has to be that used in efs hence high(), low(), close(-1), open(-3), etc.
        For example if one wanted to use the average of the last three Closes as the user defined variable then one would type the expression as (close()+close(-1)+close(-2))/3 (see following image)


        The efs will then compute the Highest and Lowest values of the expression for the user defined period (shown in image below)
        Alex

        Attached Files

        Comment


        • #5
          In the attached revision of the efs I have added a couple of sample studies to show how to use the template posted in the prior message. The studies that have been added are a moving average (using the builtin version of the study) and a Linear Regression study provided by eSignal (this is not a builtin).
          In the image below the efs is showing the Highest/lowest values over 10 bars of a 5 period Linear Regression (the latter is in magenta and is not plotted by the attached efs but if necessary it can be set up to do so).
          Alex

          Attached Files

          Comment


          • #6
            This last efs of the series is set up as a non price study and uses builtin CCI and ADX studies as the selectable variables. Also in this case all the parameters for the individual studies can be modified through Edit Studies.
            In the image below the efs is shown plotting the highest lowest values over 10 bars of the ADX (the plot of the ADX in magenta is overlayed only and not included in the efs but if necessary it can be set up to do so).
            Alex

            Attached Files

            Comment


            • #7
              Since the Back Tester does not allow to define a period in which to test a strategy I created a template that can be used for writing strategies and running them only within user defined dates.
              The script can be used with any interval and any indicator and is preset to close all open trades at the end of the defined period.
              All that needs to be done is to insert the study and the strategy in the spaces marked in the efs.
              By default the date delimiter switch is set to Off thereby allowing a strategy to run on all the bars loaded in the chart. When the strategy is in a trade the background is painted in yellow (this can be turned off in Edit Studies). To limit the back test to a certain period set the switch to On and insert the dates (the correct format is shown in the dialog box). The strategy will then run only in the selected period and all trades will be closed at the end of that period.
              Note: If only a Start date is used the strategy will run from that date to the end of the chart. If only the End date is used the strategy will run from the beginning of the chart to the End date.
              To see how the efs works insert the following lines in the strategy section of the efs (lines 58-61)
              if(1==1)
              Strategy.doLong("Buy", Strategy.MARKET, Strategy.THISBAR);

              Save the efs with a different name and load it in a chart. Then in Edit Studies switch On the limiter and set a Start and End date. A sample result is shown in the image below with the efs running on a 15 min and daily chart using the same settings (Start=20040525 and End=20040526)
              Alex

              Attached Files

              Comment


              • #8
                The attached efs will calculate and plot the Pivot Points based on the first nn minutes of trading (default is 60). To set the number of minutes adjust the Start and End Times in Edit Studies (defaults are 930 and 1030 respectively).
                The efs will work with all Time Templates and will calculate the pivots based only on the data contained inside the user defined Start/End times of the efs. The following images show that the pivots are the same when using a 24 hour or a RTH (East Coast) Time Template.


                The efs will begin computing the necessary values at the Start time and will begin plotting the Pivot Points at the End time. Note that the Pivots will not be carried over across a date change.
                The efs will also work in Tick Replay (see image below) and can be easily adapted to calculate alternate Pivot Points
                Alex


                Attached Files

                Comment


                • #9
                  The attached efs is virtually identical to the one posted in the prior message with the difference that it calculates the high and low of the first nn minutes of trading (default is 60). All notes and comments related to the prior efs are applicable to this one
                  The images below show the efs plotting the High and Low of the first 30 minutes starting from 9:30 on a chart with a 24 hour Time Template and one with a RTH Time Template
                  Alex


                  Attached Files

                  Comment


                  • #10
                    Alex, this is a nice little EFS. And it is gives some great examples.
                    Now a couple questions/extensions.

                    1. How would one change it so that it only plots lines for today?
                    I.E. no need to plot yesterdays lines or all the others on the chart.

                    2. How would one change it so it plots say the lines for the last hour of today, and extends them only through tomorrow?
                    or said another way, Starts plotting yesterday only (not before that) and then plots yesterday's last hour hi/low all the way through today until todays' last hour when it switches to today's last hour plot and drops the previous lines?

                    I'm assuming these are plot questions as this efs would certainly plot the last hour by just setting the time appropriately.


                    bigtee

                    Comment


                    • #11
                      bigtee
                      To plot the lines for the current day only do the following
                      Just before function main() insert the following line

                      PHP Code:
                      bCurrentDay false
                      Then at the very beginning of function main() insert the following

                      PHP Code:
                       if (bCurrentDay == false && getDay(0) != getDay(-1)){ 
                              var 
                      vTime getValue("time"); 
                              var 
                      vDate = new Date(); 
                              var 
                      sTime = (vTime.getMonth()+1+"/"+vTime.getDate()+"/"+vTime.getFullYear()); 
                              var 
                      sToday = (vDate.getMonth()+1+"/"+vDate.getDate()+"/"+vDate.getFullYear()); 
                              if ( 
                      sTime == sToday ) { 
                                  
                      bCurrentDay true
                              } 
                          } 
                          
                          if (
                      bCurrentDay==false){
                          return;
                          } 
                      FWIW this block of code was taken from a script by JasonK and can be applied to virtually any efs to plot a return for the current day only. Here below is the result of the added code.


                      As to your second question neither of these two efs will plot across a date change. I am however working on some other variants that will do that
                      Alex

                      Comment


                      • #12
                        Thanks Alex.

                        I'm looking forward to your efs that plot across a date change.

                        You also mentioned that the one day code could be applied to most any efs to plot a return only for current day.

                        Below is one that it does not work for. It continues to plot all days.

                        Any idea why?

                        bigtee


                        function preMain() {

                        setPriceStudy(true);
                        setShowTitleParameters( false );
                        setStudyTitle("Day O,H,L");
                        setShowCursorLabel( false );

                        setDefaultBarStyle(PS_DOT,0); // plot for open
                        setDefaultBarFgColor(Color.yellow,0);
                        setDefaultBarThickness(2,0);
                        setPlotType(PLOTTYPE_FLATLINES,0);

                        setDefaultBarStyle(PS_DOT,1); // plot for high
                        setDefaultBarFgColor(Color.green,1);
                        setDefaultBarThickness(2,1);
                        setPlotType(PLOTTYPE_FLATLINES,1);

                        setDefaultBarStyle(PS_DOT,2); // plot for low
                        setDefaultBarFgColor(Color.red,2);
                        setDefaultBarThickness(2,2);
                        setPlotType(PLOTTYPE_FLATLINES,2);

                        }

                        bCurrentDay = false;

                        function main() {

                        if (bCurrentDay == false && getDay(0) != getDay(-1)){
                        var vTime = getValue("time");
                        var vDate = new Date();
                        var sTime = (vTime.getMonth()+1+"/"+vTime.getDate()+"/"+vTime.getFullYear());
                        var sToday = (vDate.getMonth()+1+"/"+vDate.getDate()+"/"+vDate.getFullYear());
                        if ( sTime == sToday ) {
                        bCurrentDay = true;
                        }
                        }

                        if (bCurrentDay==false){
                        return;
                        }


                        vOpen = call("getTodayOHLC.efs", "Open");
                        vHigh = call("getTodayOHLC.efs", "High");
                        vLow = call("getTodayOHLC.efs", "Low");


                        return new Array(vOpen, vHigh, vLow);


                        }

                        Comment


                        • #13
                          bigtee
                          Move the following lines down to just before the return new Array statement
                          if (bCurrentDay==false){
                          return;
                          }

                          and it will plot only today's lines
                          Alex

                          Comment


                          • #14
                            Thank you again Alex. Worked like a charm!

                            What is the reason I had to move the lines on my efs but not on yours?

                            By the way, between your 1st XX min and the plot one day efs, I have been able to generate several nice time saving helpers.

                            Also figured out that the one day plot efs can be used to plot different things in the past than today, for example....

                            if (bCurrentDay==false){
                            return new Array(vHigh, vLow);
                            }

                            return new Array(vHigh, vLow, vOpen);

                            This plots the high and the low every day but the open just for today.

                            Again, nice work and same to JasonK for his little plot on 1 day code.

                            Now I can't wait for your efs that plots across a day boundary.

                            bigtee

                            Comment


                            • #15
                              NOTE: An EFS2 version of this efs is now available here

                              The attached revision of the efs posted here now includes an option to show or hide the High/Low lines during the first nn minutes of trading.
                              The following images show the efs with the option set to Show (top) and Hide (bottom).
                              Alex


                              Attached Files

                              Comment

                              Working...
                              X