Announcement

Collapse
No announcement yet.

Counting bars since condition was true

Collapse
X
 
  • Filter
  • Time
  • Show
Clear All
new posts

  • Counting bars since condition was true

    Hello,
    I am new to EFS and I am trying to convert my indicators from my old platform.
    One thing I use a lot is to count how many bars have passed since a condition was true. Unfortunately I can't find a way to do it with EFS and I hope to find someone here in the forum that can help me.
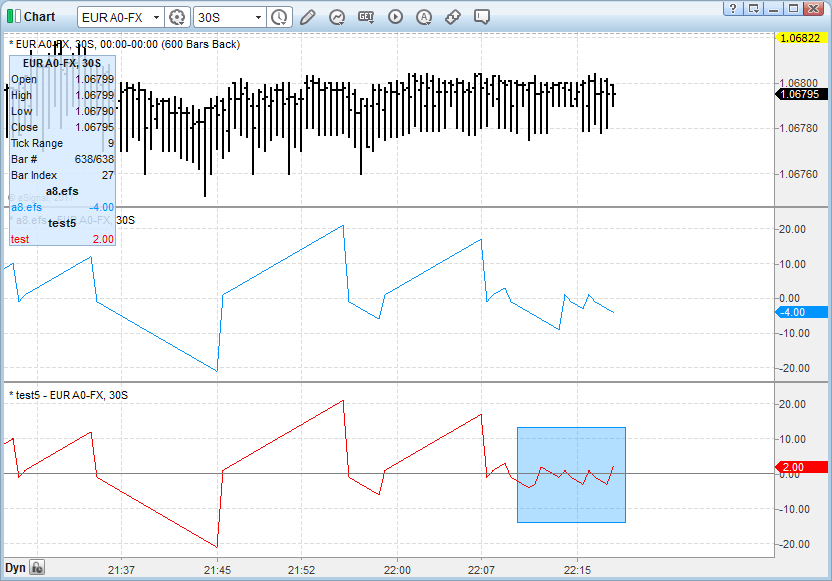
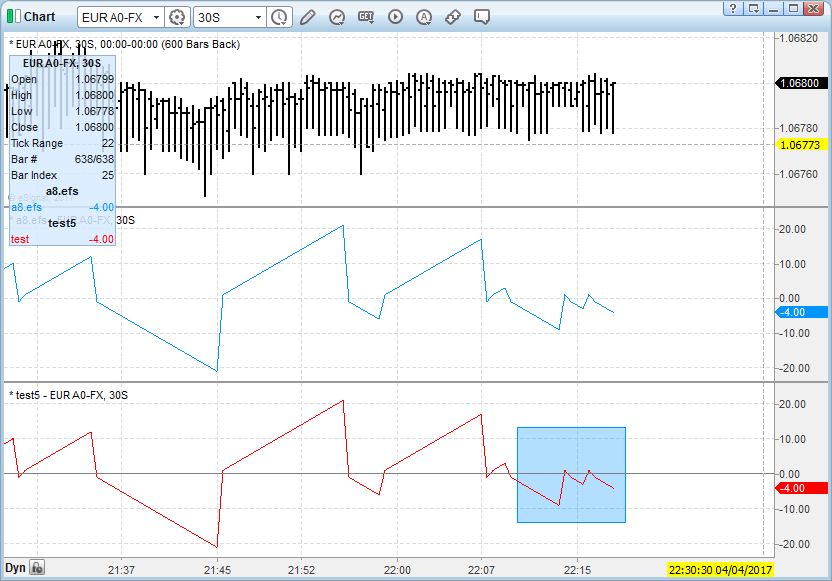
    In the example attached I try to calculate how many bars are passed since the histogram of a PPO indicator crossed above or below the Zeroline.
    At a first sight it seems to work, but when used in realtime it keeps adding values on the same bar for every tick.
    I have no idea what I am doing wrong. I do want the indicator to update every tick, but not to add the value for every tick! Just to check the status.
    I hope I stated my problem correctly.
    Thank you for your help

    PHP Code:

    function preMain()
    {
    addBand(0PS_SOLID1Color.grey,"zeroLine");
    setStudyTitle("test5");
    setCursorLabelName("test"0);

    setPlotType(PLOTTYPE_LINE,0);
    setDefaultBarThickness1);
    setDefaultBarFgColor(Color.yellow0);


    }

    //var myPPO = null;
    function main()
    {
        var 
    myPPO efsInternal("calc_PPO"1226);
        var 
    theHistoAvg efsInternal("calc_HistoAvg"myPPO);
        var 
    theHisto efsInternal("calc_Histo"myPPOtheHistoAvg);
        var 
    theHistoTrend efsInternal("calc_HistoTrend"theHisto);

    return 
    theHistoTrend;
    }


    function 
    calc_PPO(fastslow)
        {
        var 
    fastAvg ema(fast);
        var 
    slowAvg ema(slow);
        var 
    PPO = (fastAvg-slowAvg)/slowAvg*1000;
        return 
    PPO;
        }

    function 
    calc_HistoAvg(getPPO)
        {
        var 
    HistoAvg ema(9getPPO);
        return 
    HistoAvg;
        }

    function 
    calc_Histo(getPPOgetHistoAvg)
        {
        var 
    Histo getPPO.getValue(0) - getHistoAvg.getValue(0);
        return 
    Histo;
        }

    var 
    histoTrend 0;

    function 
    calc_HistoTrend(getHisto)
        {

        if (
    getHisto.getValue(0) > && getHisto.getValue(-1) < 0)
            {
            
    histoTrend 1;
            }else
        if (
    getHisto.getValue(0) < && getHisto.getValue(-1) > 0)
            {
            
    histoTrend = -1;
            }else
        if (
    getHisto.getValue(0) > && getHisto.getValue(-1) > 0)
            {
            
    histoTrend histoTrend+1;
            }else
        if (
    getHisto.getValue(0) < && getHisto.getValue(-1) < )
            {
            
    histoTrend histoTrend-1;
            }

        return 
    histoTrend;

        } 
    Last edited by momonk; 04-04-2017, 02:31 PM.

  • #2
    After feeling I climbed a mountain I think I found a working solution.
    Granted it seems very convoluted, but I couldn't think anything more elegant. I have been working with EFS and JavaScript for just few days.....
    If someone can find a better way I would be really happy to learn from it.
    Anyway.... here it is

    PHP Code:
    function preMain()
    {
    addBand(0PS_SOLID1Color.grey,"zeroLine");
    setStudyTitle("test5");
    setCursorLabelName("test"0);

    setPlotType(PLOTTYPE_LINE,0);
    setDefaultBarThickness1);
    setDefaultBarFgColor(Color.yellow0);


    }

    var 
    histoTrend 0;
    var 
    theSwitch 0;
    var 
    HistoSum 0;
    function 
    main()
    {
        var 
    myPPO efsInternal("calc_PPO"1226);
        var 
    theHistoAvg efsInternal("calc_HistoAvg"myPPO);
        var 
    theHisto efsInternal("calc_Histo"myPPOtheHistoAvg);
        var 
    theHistoTrend efsInternal("calc_HistoTrend"theHisto);
        var 
    theHistoSum efsInternal("calc_HistoSum"theHisto);
        var 
    theTrendSwitch efsInternal("calc_TrendSwitch"theHisto);
        var 
    histoSumPast theHistoSum.getValue(-1);

        var 
    myArray = new Array(theHistoSum.getValue(-1), theHistoTrend.getValue(0));
        var 
    count 0;
        for(var 
    i=myArray.lengthi--;)
        {
        
    count+=myArray[i];
        }

        var 
    theCount 0;
        if(
    theTrendSwitch == || theTrendSwitch == -1)
        {
            
    theCount theTrendSwitch
        
    }else
        
    theCount count;


    return 
    theCount;
    }


    function 
    calc_PPO(fastslow)
        {
        var 
    fastAvg ema(fast);
        var 
    slowAvg ema(slow);
        var 
    PPO = (fastAvg-slowAvg)/slowAvg*1000;
        return 
    PPO;
        }

    function 
    calc_HistoAvg(getPPO)
        {
        var 
    HistoAvg ema(9getPPO);
        return 
    HistoAvg;
        }

    function 
    calc_Histo(getPPOgetHistoAvg)
        {
        var 
    Histo getPPO.getValue(0) - getHistoAvg.getValue(0);
        return 
    Histo;
        }
    function 
    calc_HistoTrend(getHisto)
        {

        if (
    getHisto.getValue(0) > && getHisto.getValue(-1) < 0)
            {
            
    histoTrend 1;
            }else
        if (
    getHisto.getValue(0) < && getHisto.getValue(-1) > 0)
            {
            
    histoTrend = -1;
            }else
        if (
    getHisto.getValue(0) > && getHisto.getValue(-1) > 0)
            {
            
    histoTrend histoTrend;
            }else
        if (
    getHisto.getValue(0) < && getHisto.getValue(-1) < )
            {
            
    histoTrend histoTrend;
            }
        return 
    histoTrend;
        }

    function 
    calc_HistoSum(getHisto)
        {
            var 
    barState getBarState();
        if (
    getHisto.getValue(0) > && getHisto.getValue(-1) < && barState == BARSTATE_NEWBAR)
            {
            
    HistoSum 1;
            }else
        if (
    getHisto.getValue(0) < && getHisto.getValue(-1) > && barState == BARSTATE_NEWBAR  )
            {
            
    HistoSum = -1;
            }else
        if (
    getHisto.getValue(0) > && getHisto.getValue(-1) > && barState == BARSTATE_NEWBAR )
            {
            
    HistoSum HistoSum+1;
            }else
        if (
    getHisto.getValue(0) < && getHisto.getValue(-1) < && barState == BARSTATE_NEWBAR  )
            {
            
    HistoSum HistoSum-1;
            }
        return 
    HistoSum;

        }
    function 
    calc_TrendSwitch(getHisto)
        {
        if (
    getHisto.getValue(0) > && getHisto.getValue(-1) < 0)
            {
            
    TrendSwitch 1;
            }else
        if (
    getHisto.getValue(0) < && getHisto.getValue(-1) > 0)
            {
            
    TrendSwitch = -1;
            }else
            
    TrendSwitch 0;
        return 
    TrendSwitch;
        } 

    Comment


    • #3
      momonk
      Enclosed below is a simpler and more efficient way you could write your formula (FWIW I did not include the preMain() function as no changes are required in that). In addition this script corrects an issue you have in yours when that is running in real time and the histogram oscillates above and below the 0 on the same bar which affects your count
      For an example of this see the following two images


      In the top image the upper plot is my script and the lower is yours. The image was captured after letting the formulas run for a while. Note in your plot the section highlighted by the rectangle
      In the bottom image you have the same but after refreshing your formula. As you can see your formula behaved differently in real time than on historical bars

      As an aside note that I do not calculate the PPO myself and instead use the osc() function which is the same.
      Also note that rather than calculating the counter on my own I rely on the getCurrentBarCount() function (which is an internal counter that numbers the bars from the oldest one on the chart going forwards) to calculate the number of bars from a given point ie from where the histogram crosses up or down.
      Alex

      PHP Code:

      var xOsc null;
      var 
      xOscEMA null;
      var 
      nStartCount 0;
      var 
      nStartCount1 0;
      var 
      nTrend 0;
      var 
      nTrend1 0;

      function 
      main(){
          if(
      getBarState() == BARSTATE_ALLBARS){ //when all bars are loaded
              
      xOsc osc(12,26,1); //initialize study
              
      xOscEMA ema(9,xOsc); //as above
              
      nStartCount 0//reset global variable to starting value
              
      nStartCount1 0//as above etc
              
      nTrend 0;
              
      nTrend1 0;
          }
          if(
      getBarState() == BARSTATE_NEWBAR) { //at the start of each new bar
              
      nTrend1 nTrend//assign the last value to the variable to define what it was at the prior bar
              
      nStartCount1 nStartCount//as above
          
      }

          var 
      nHist xOsc.getValue(0) - xOscEMA.getValue(0);
          var 
      nHist1 xOsc.getValue(-1) - xOscEMA.getValue(-1);
          var 
      nBarCount getCurrentBarCount();
          var 
      nCounter 0;

          if(
      nTrend1 != 1){ //if at the prior bar nTrend was not equal to 1 i.e. trend was not up
              
      if(nHist && nHist1 0){ //if the histogram crossed above 0
                  
      nStartCount nBarCount//then set your variable
                  
      nTrend 1//as above
              
      }else{
                  
      nStartCount nStartCount1//else reset your variable to its prior value
                  
      nTrend nTrend1//as above
              
      }
          }
          if(
      nTrend1 != -1){ //same routine as above but for downtrend
              
      if(nHist && nHist1 0){
                  
      nStartCount nBarCount;
                  
      nTrend = -1;
              }else{
                  
      nStartCount nStartCount1;
                  
      nTrend nTrend1;
              }
          }
          if(
      nTrend == 1)  nCounter = (nBarCount nStartCount) +1//if trend is up calculate difference between bars + 1
          
      if(nTrend == -1nCounter = ((nBarCount nStartCount) +1) * (-1); //as above

          
      return nCounter;


      Originally posted by momonk View Post
      After feeling I climbed a mountain I think I found a working solution.
      Granted it seems very convoluted, but I couldn't think anything more elegant. I have been working with EFS and JavaScript for just few days.....
      If someone can find a better way I would be really happy to learn from it.
      Anyway.... here it is

      PHP Code:
      function preMain()
      {
      addBand(0PS_SOLID1Color.grey,"zeroLine");
      setStudyTitle("test5");
      setCursorLabelName("test"0);

      setPlotType(PLOTTYPE_LINE,0);
      setDefaultBarThickness1);
      setDefaultBarFgColor(Color.yellow0);


      }

      var 
      histoTrend 0;
      var 
      theSwitch 0;
      var 
      HistoSum 0;
      function 
      main()
      {
      var 
      myPPO efsInternal("calc_PPO"1226);
      var 
      theHistoAvg efsInternal("calc_HistoAvg"myPPO);
      var 
      theHisto efsInternal("calc_Histo"myPPOtheHistoAvg);
      var 
      theHistoTrend efsInternal("calc_HistoTrend"theHisto);
      var 
      theHistoSum efsInternal("calc_HistoSum"theHisto);
      var 
      theTrendSwitch efsInternal("calc_TrendSwitch"theHisto);
      var 
      histoSumPast theHistoSum.getValue(-1);

      var 
      myArray = new Array(theHistoSum.getValue(-1), theHistoTrend.getValue(0));
      var 
      count 0;
      for(var 
      i=myArray.lengthi--;)
      {
      count+=myArray[i];
      }

      var 
      theCount 0;
      if(
      theTrendSwitch == || theTrendSwitch == -1)
      {
      theCount theTrendSwitch
      }else
      theCount count;


      return 
      theCount;
      }


      function 
      calc_PPO(fastslow)
      {
      var 
      fastAvg ema(fast);
      var 
      slowAvg ema(slow);
      var 
      PPO = (fastAvg-slowAvg)/slowAvg*1000;
      return 
      PPO;
      }

      function 
      calc_HistoAvg(getPPO)
      {
      var 
      HistoAvg ema(9getPPO);
      return 
      HistoAvg;
      }

      function 
      calc_Histo(getPPOgetHistoAvg)
      {
      var 
      Histo getPPO.getValue(0) - getHistoAvg.getValue(0);
      return 
      Histo;
      }
      function 
      calc_HistoTrend(getHisto)
      {

      if (
      getHisto.getValue(0) &amp;gt&amp;amp;&amp;ampgetHisto.getValue(-1) &amp;lt0)
      {
      histoTrend 1;
      }else
      if (
      getHisto.getValue(0) &amp;lt&amp;amp;&amp;ampgetHisto.getValue(-1) &amp;gt0)
      {
      histoTrend = -1;
      }else
      if (
      getHisto.getValue(0) &amp;gt&amp;amp;&amp;ampgetHisto.getValue(-1) &amp;gt0)
      {
      histoTrend histoTrend;
      }else
      if (
      getHisto.getValue(0) &amp;lt&amp;amp;&amp;ampgetHisto.getValue(-1) &amp;lt)
      {
      histoTrend histoTrend;
      }
      return 
      histoTrend;
      }

      function 
      calc_HistoSum(getHisto)
      {
      var 
      barState getBarState();
      if (
      getHisto.getValue(0) &amp;gt&amp;amp;&amp;ampgetHisto.getValue(-1) &amp;lt&amp;amp;&amp;ampbarState == BARSTATE_NEWBAR)
      {
      HistoSum 1;
      }else
      if (
      getHisto.getValue(0) &amp;lt&amp;amp;&amp;ampgetHisto.getValue(-1) &amp;gt&amp;amp;&amp;ampbarState == BARSTATE_NEWBAR )
      {
      HistoSum = -1;
      }else
      if (
      getHisto.getValue(0) &amp;gt&amp;amp;&amp;ampgetHisto.getValue(-1) &amp;gt&amp;amp;&amp;ampbarState == BARSTATE_NEWBAR )
      {
      HistoSum HistoSum+1;
      }else
      if (
      getHisto.getValue(0) &amp;lt&amp;amp;&amp;ampgetHisto.getValue(-1) &amp;lt&amp;amp;&amp;ampbarState == BARSTATE_NEWBAR )
      {
      HistoSum HistoSum-1;
      }
      return 
      HistoSum;

      }
      function 
      calc_TrendSwitch(getHisto)
      {
      if (
      getHisto.getValue(0) &amp;gt&amp;amp;&amp;ampgetHisto.getValue(-1) &amp;lt0)
      {
      TrendSwitch 1;
      }else
      if (
      getHisto.getValue(0) &amp;lt&amp;amp;&amp;ampgetHisto.getValue(-1) &amp;gt0)
      {
      TrendSwitch = -1;
      }else
      TrendSwitch 0;
      return 
      TrendSwitch;

      Comment


      • #4
        Thank you vey much Alex!
        It looks fantastic!
        Thank you also for the comment lines - really really helpful
        Mauro

        Comment

        Working...
        X