 Tweet
Tweet
Is there any way to utilize the Overlay function with Volume only. I would like to take the Volume from two issues, say IBM & MSFT, add them together and have a line (or a bargraph) drawn.
-
John Pilger -
Re: Overlay using volume
John
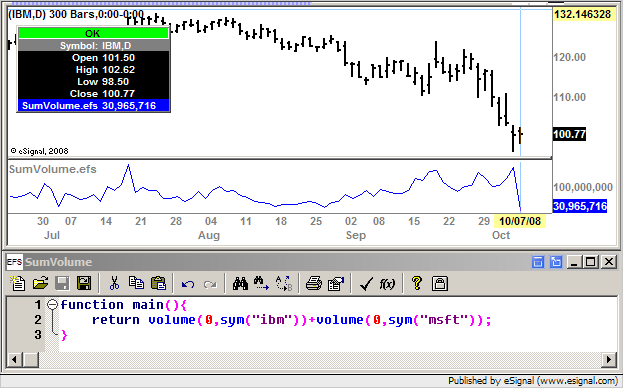
The overlay function will not sum the Volumes of the overlayed symbols however you can do what [I think] you are asking with a simple formula (see the example in the screenshot enclosed below)
Alex
Originally posted by pilg
Is there any way to utilize the Overlay function with Volume only. I would like to take the Volume from two issues, say IBM & MSFT, add them together and have a line (or a bargraph) drawn. -
Thank you.
Thank you for the help.
It does look like what I want to do, but I am unfamiliar with how to reproduce/enter the formula. Can you give me an assist?
jpJohn PilgerComment
-
Re: Thank you.
John
The attached efs will sum the Volume of two user defined symbols (default symbols are IBM and MSFT).
Download and Save the formula in the Formulas folder (or any one of its subfolders) then right click on the chart, select Formulas and click on the formula. You can change the symbols at any time through Edit Studies
Alex
Originally posted by pilg
Thank you for the help.
It does look like what I want to do, but I am unfamiliar with how to reproduce/enter the formula. Can you give me an assist?
jpComment
-
Alex,
After looking through everything, I cannot find a formula folder, etc. I am using QCharts. Am I in the wrong forum perhaps?
If I am, thank you anyway for the assist.John PilgerComment
-
-
John
This is the forum for eSignal which is why I assumed that you were referring to that product. Sorry for the confusion.
The forum for QCharts can be found here
Alex
Originally posted by pilg
Alex,
After looking through everything, I cannot find a formula folder, etc. I am using QCharts. Am I in the wrong forum perhaps?
If I am, thank you anyway for the assist.Comment
Comment