Announcement

Collapse
No announcement yet.

$tick Quandry

Collapse
X
 
  • Filter
  • Time
  • Show
Clear All
new posts

  • $tick Quandry

    Hello,

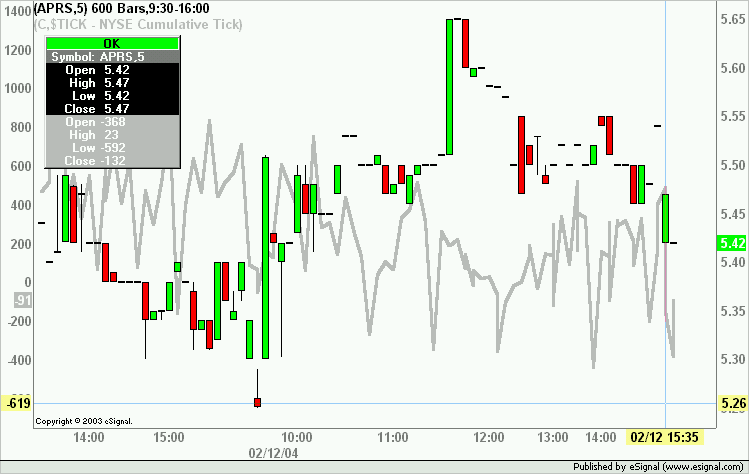
    I wonder if someone could please explain to me how is it that the $TICK has a different reading for the two charts. You'll see that in the first chart, SUNW the $TICK has a close of 75 at 9:30 and in the second chart, APRS the $TICK has a different close (189) at the same time of 9:30. Should it not be the same?

    Funny thing is its only happening with APRS - when I compare the $TICK reading with any other chart I get a close of 75.

    Please, try it for yourself, its really weird.

    Cheers

    Carlton
    Attached Files

  • #2
    Here is the second chart showing APRS so you can see what I mean.

    Carlton
    Attached Files

    Comment


    • #3
      Hi,

      Do you see where $TICK close for sunw is 75 but aprs its 189? I know it should be the same but don't understand why its different.

      Any help would be appreciated.

      Cheers

      Carlton

      Comment


      • #4
        Hi Carlton --

        $TICK / $TICKI / $TICKQ are all the 'overall tick count' for the market -- not a specific stock.

        $TICK is 'upticks vs. downticks' on the NYSE
        $TICKI is up vs. down of the DOW components -- this is a very followed indicator
        $TICKQ is Nasdaq

        The concept is similar to any other indicator:
        - Divergence in price vs. tick high/low
        - Overbought/oversold (This works best w/ TICKI because it's a smaller representation of stocks)

        Hope that helps!

        Comment


        • #5
          Soylent,

          Thanks for getting back to me. However, I'm afraid I haven't made myself clear. I know the $tick does not relate to a particular stock. I'm actually trying to say that the $tick should remain the same no matter what stock is in the price chart.

          If you take a close look at the images you'll see that the $tick says 75 on the chart showing sunw and 189 on the chart showing aprs. Whereas they should both say 75.

          Please take another look at the image.

          I have attached a copy of formula that I used on that charts.

          Cheers

          Carlton
          Attached Files

          Comment


          • #6
            Carlton
            The reason for this issue is that APRS is missing some bars due to no trades occurring in that period of time. This causes the plot of the efs to go out of sync prior to the missing bar(s).
            For a brief explanation on how this happens you may want to see this post.
            Alex

            Comment


            • #7
              Alex,

              Thanks. However, I'm still not quite sure why that should affect the $tick. Shouldn't the $tick be independent of anything on the chart? It really shouldn't matter if no trades occurred because it stands alone, or am I missing something here?

              Cheers


              Carlton

              Comment


              • #8
                Carlton
                No it is not independent when the values are called through this efs. The explanation I pointed you to illustrates how ie that the sync is attained by relative bar index and not by time stamp. Hence, if some bars are missing in APRS and not in $TICK then the values of $TICK will be shifted respect to APRS. Having said that it is possible to create an efs that keeps the two plots always in sync but it would have to be completely rewritten and it is not the simplest of undertakings
                Alex

                Comment


                • #9
                  Alex,

                  Once again thanks. So, are you saying that this efs is unreliable? That is such a shame, I really liked it.

                  Carlton

                  Comment


                  • #10
                    Carlton
                    That is not quite what I said. If the data series of the two symbols are complete then the efs is in sync all the time. If they are not then the plot of the efs will be out of sync PRIOR to the time where either symbol has a missing bar. For current values ie in real time it is always in sync.
                    Alex

                    Comment


                    • #11
                      Alex,

                      Thanks. I'm not sure if I will use this efs in realtime as I can never really be sure if its in sync and therefore correct. It may be better to just have seperate chart showing the $TICK.

                      Cheers

                      Carlton

                      Comment


                      • #12
                        Carlton
                        You can use the Multiple Symbols overlay. In that mode the plots are always in sync.
                        Alex

                        Comment


                        • #13
                          Alex,

                          Can you show how to use the overlay feature?

                          Thanks

                          Carlton

                          Comment


                          • #14
                            Carlton
                            Select the chart you want to overlay a symbol on. Then type the interval (or symbol) so as to open the Change Symbol dialog box.
                            Click the Multiple Symbols button and type the symbol in the first available box.
                            When you click OK you will then be prompted to set the Properties of the overlayed symbol. In the image below you can see APRS with $TICK overlayed as a Line.
                            Alex

                            Comment


                            • #15
                              Alex,

                              Thats great.

                              Thanks

                              Carlton

                              Comment

                              Working...
                              X