 Tweet
Tweet
I use ths efs tickma
this plot the histogram but only for the value of the close,
if possible plot every information in each bar ? close , high and low
as for think o swim
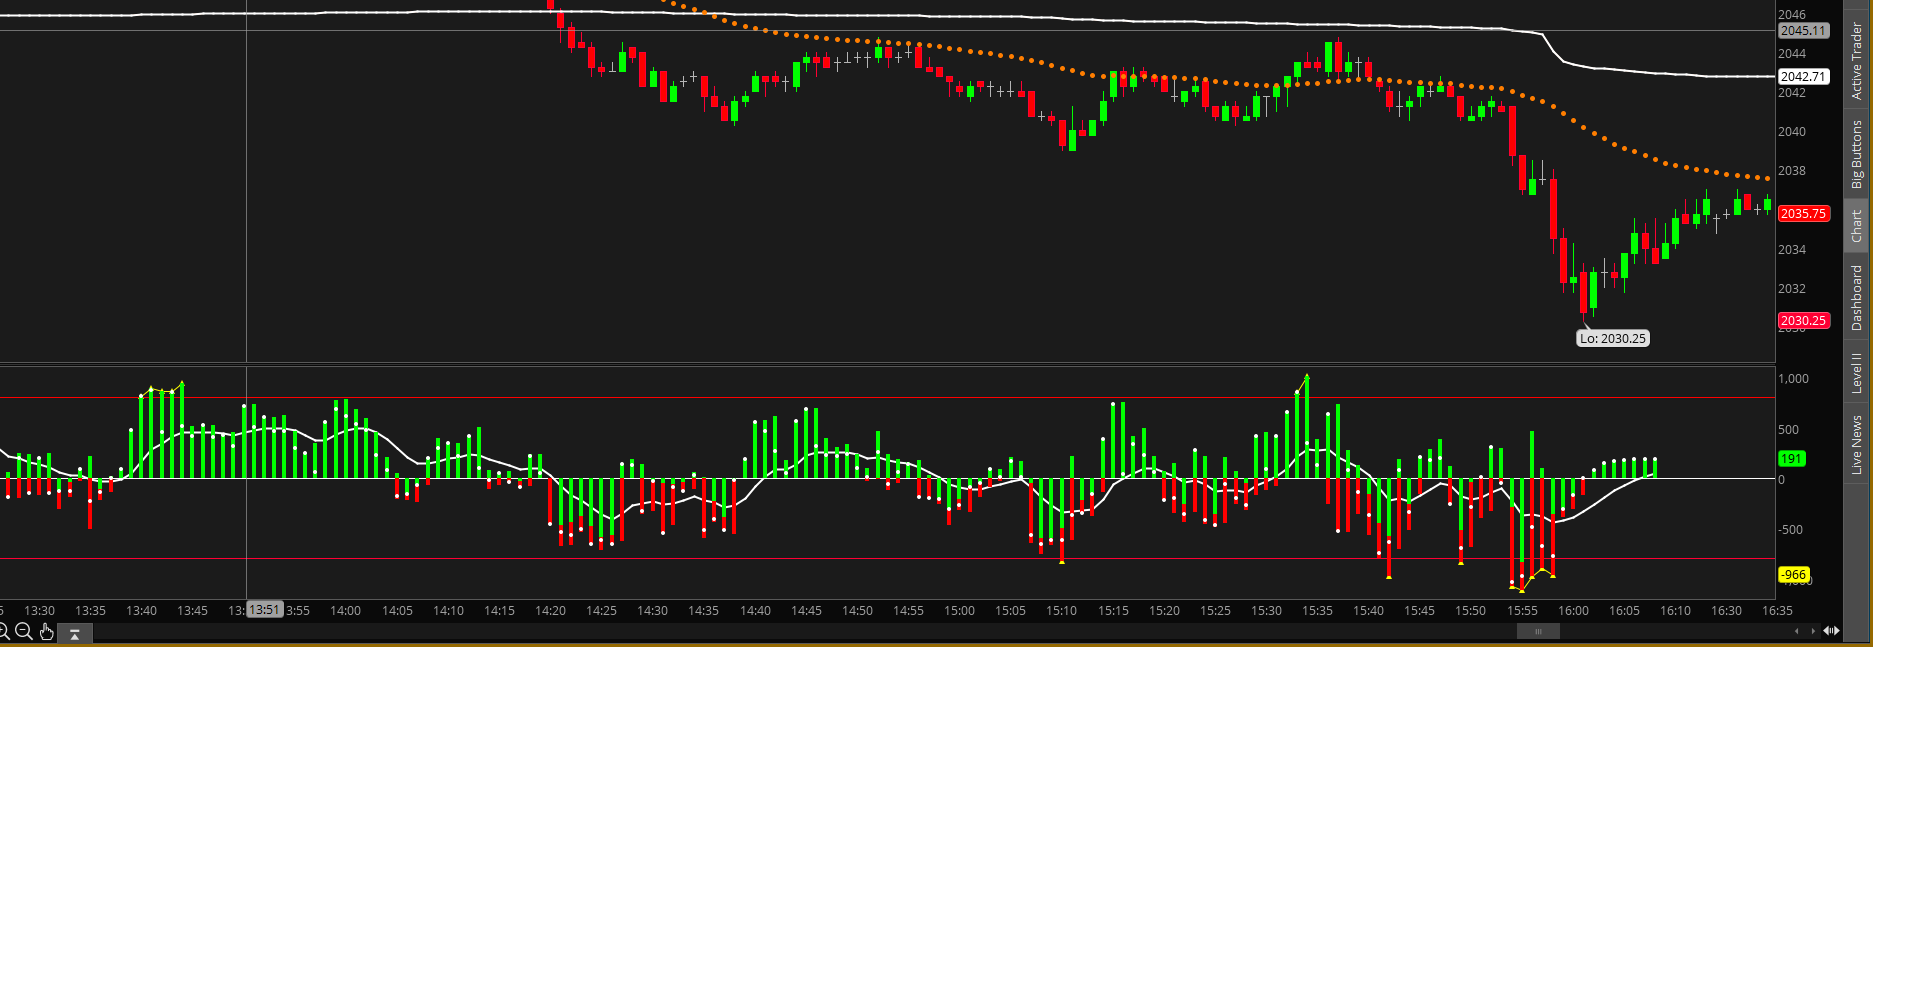
how can i plot this information ?
thank fr any suggestion .
Marco
this plot the histogram but only for the value of the close,
if possible plot every information in each bar ? close , high and low
as for think o swim
how can i plot this information ?
thank fr any suggestion .
Marco
Comment