Announcement

Collapse
No announcement yet.

How easy are studies on studies in EFS2?

Collapse
This topic is closed.
X
X
 
  • Filter
  • Time
  • Show
Clear All
new posts

  • How easy are studies on studies in EFS2?

    It is now very easy to write studies on studies in EFS2 irrespective of whether they are created using builtin or non builtin studies. In most cases it is actually even easier than using the Formula Wizard.
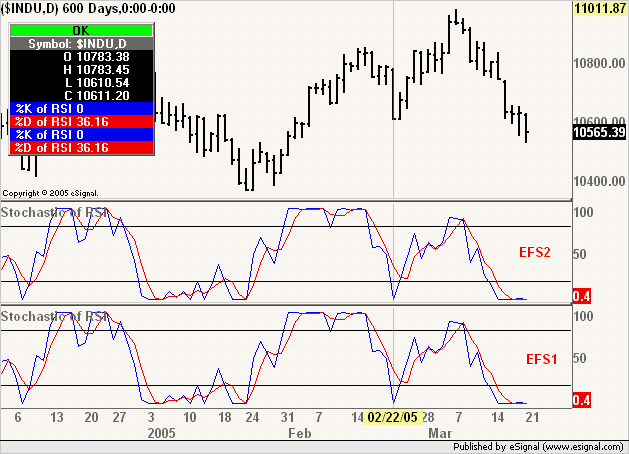
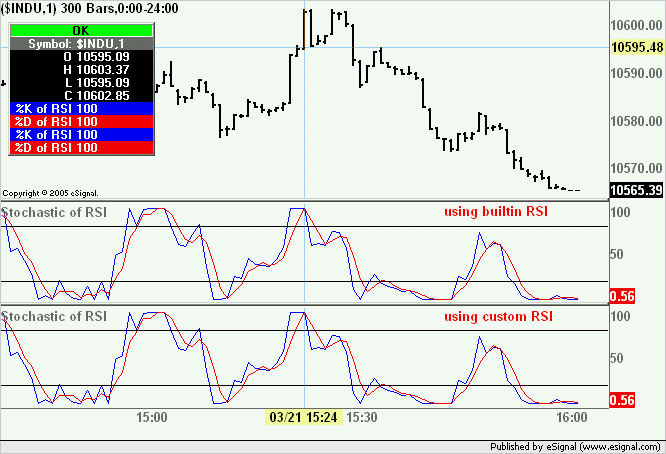
    Here is a prime example of EFS2 code for a relatively common study ie the Stochastic of RSI (the same applies to Stoch of CCI or Stoch of Momentum, etc).

    PHP Code:
    function preMain() {
        
    setStudyTitle("Stochastic of RSI ");
        
    setCursorLabelName("\%K of RSI"0);
        
    setCursorLabelName("\%D of RSI"1);
        
    setDefaultBarFgColor(Color.blue0);
        
    setDefaultBarFgColor(Color.red1); 
        
    addBand(20PS_SOLID1Color.black);
        
    addBand(80PS_SOLID1Color.black);
        
    setStudyMax(105);
        
    setStudyMin(-5);
    }

    function 
    main() {

        return new Array (
    stochK(14,1,3,rsi(14)),stochD(14,1,3,rsi(14)));

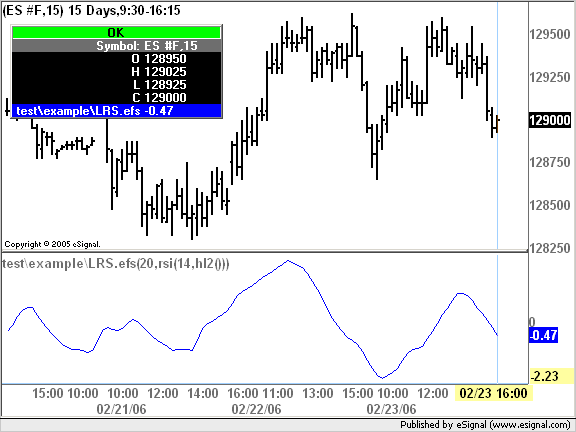
    In the top pane of the following chart is the plot returned by the script shown above compared to that returned by the equivalent EFS1 code


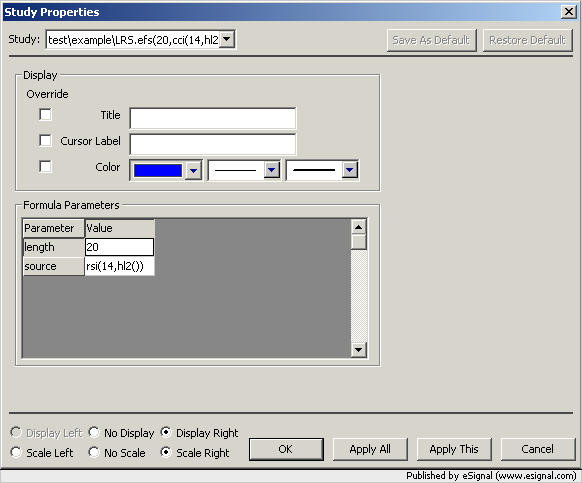
    A fully customizable version of the efs (preset for use with multiple symbols/intervals) is attached and also available here
    To run this study you need eSignal version 7.9 Beta 1 or later
    Alex


    As a note of interest here is the EFS1 code required to compute the same Stochastic of RSI.
    I believe the difference speaks for itself.

    PHP Code:
    function preMain() {
        
    setStudyTitle("Stochastic of RSI ");
        
    setCursorLabelName("\%K of RSI"0);
        
    setCursorLabelName("\%D of RSI"1);
        
    setDefaultBarFgColor(Color.blue0);
        
    setDefaultBarFgColor(Color.red1); 
        
    addBand(20PS_SOLID1Color.black);
        
    addBand(80PS_SOLID1Color.black);
        
    setStudyMax(105);
        
    setStudyMin(-5);
    }

    function 
    HHrsi() {
        var 
    hh null;
        
    hh aRSI[0];
        for(
    014i++) {
            
    hh Math.max(hhaRSI[i]);
        }
        return 
    hh;
    }

    function 
    LLrsi() {
        var 
    ll null;
        
    ll aRSI[0];;
        for(
    014i++) {
            
    ll Math.min(llaRSI[i]);
        }
        return 
    ll;
    }

    var 
    vStochRSI null;

    function 
    StochK() {
        var 
    nState getBarState();
        var 
    percentK;
        var 
    vValue;
        var 
    llhh;
        var 
    sum 0;

        
    ll LLrsi(14)       
        
    hh HHrsi(14);

        if (
    nState == BARSTATE_NEWBAR && vStochRSI != null) {
            
    aStoch.pop();
            
    aStoch.unshift(vStochRSI);
        }

        
    vStochRSI = ((vRSI ll) / (hh ll)) * 100;
        
    aStoch[0] = vStochRSI;

        if (
    vSmooth == "true") {
            for(
    03i++) {
                
    sum += aStoch[i];
            }
            
    sum /= 3;
            return 
    sum;
        } else {
            return 
    vStochRSI;
        }
    }

    function 
    StochD() {   
        var 
    sum 0;
        for(
    03i++) { 
           
    sum += aStochb[i];
        }
        
    sum sum 3;
        return 
    sum;
    }

    var 
    RSIstudy null;
    var 
    aRSI null;
    var 
    vRSI null;
    var 
    aStoch null;
    var 
    aStochb null;
    var 
    vSmooth "false";
    var 
    bEdit true;
    var 
    vK null;
    var 
    vD null;
        
    function 
    main() {
        var 
    nState getBarState();
        
        if (
    bEdit == true || RSIstudy == null || aRSI == null || aStoch == null) {
            
    RSIstudy = new RSIStudy(14"Close");
            
    aStoch = new Array(Math.max(114));
            
    aStochb = new Array(3);
            
    aRSI = new Array(Math.max(141));
            
    vSmooth true;
            
    bEdit false;
        }
        
        if (
    nState == BARSTATE_NEWBAR && vRSI != null) {
            
    aRSI.pop();
            
    aRSI.unshift(vRSI);
            
    aStochb.pop();
            
    aStochb.unshift(vK);
        }
        
        
    vRSI RSIstudy.getValue(RSIStudy.RSI);
        if (
    vRSI == null) return;
        
    aRSI[0] = vRSI;

        
    vK null;
        
    vD null;
        
        var 
    vLen Math.max(141);
        if (
    aRSI[vLen-1] != null) {
            
    vK StochK(14141);
            
    aStochb[0] = vK;
            
    vD StochD(3);
        } else {
            return;
        }    

        return new Array(
    vKvD);

    Attached Files

  • #2
    Stochastic of RSI part 2

    In the first example in the thread I created a study on study using only the builtins. Creating studies on studies even without using a builtin study as a source can be equally easy.
    For the purpose of this example I will create a Stochastic of RSI using the RSIEnhanced.efs that comes preinstalled with eSignal and that can be found in the Library subfolder of Formulas. That efs replicates the one available in Basic Studies and is custom written.
    To create this version of the Stochastic of RSI I will be using the new efs() function. You can find more imformation and examples on efs() and efsInternal() function in this thread.
    In the image below the plot the from the enclosed efs is compared to that of the StochRSI.efs attached to the prior message.
    Alex

    PHP Code:
    function preMain() {
        
    setStudyTitle("Stochastic of RSI ");
        
    setCursorLabelName("\%K of RSI"0);
        
    setCursorLabelName("\%D of RSI"1);
        
    setDefaultBarFgColor(Color.blue0);
        
    setDefaultBarFgColor(Color.red1); 
        
    addBand(20PS_SOLID1Color.black);
        
    addBand(80PS_SOLID1Color.black);
        
    setStudyMax(105);
        
    setStudyMin(-5);
    }

    function 
    main() {

        var 
    nStochrsiK stochK(14,1,3,efs("/Library/RSIEnhanced.efs",0,14));
        var 
    nStochrsiD stochD(14,1,3,efs("/Library/RSIEnhanced.efs",0,14));

        return new Array (
    nStochrsiK,nStochrsiD);


    NOTE: For more information or questions on EFS2 visit the EFS 2 Development Forum

    Comment


    • #3
      Highest High/Lowest Low of RSI

      Unlike the EFS1 builtin studies all the EFS2 builtin studies can accept any eSignal or custom built series as the source (the only exceptions are ADX/DM, Accumulation/Distribution and On Balance Volume).
      So if we want for example to find the highest or lowest value of a series (eSignal or otherwise) we can now use the Donchian Study. Previously instead we had to write a custom script to obtain the same result (see as an example this post).
      In the PHP box below you can see how it can be easily done with the new EFS2 syntax and builtin studies (the example shows how to determine the highest/lowest value of the RSI)
      Alex

      PHP Code:
      function preMain() {

          
      setPriceStudy(false);
          
      setStudyTitle("Donchian");
          
      setCursorLabelName("DCUpr"0);
          
      setCursorLabelName("DCMid"1);
          
      setCursorLabelName("DCLwr"2);
          
      setDefaultBarFgColor(Color.blue0);
          
      setDefaultBarFgColor(Color.red1);
          
      setDefaultBarFgColor(Color.blue2);
      }

      function 
      main() {

          return new Array (
      upperDonchian(20,rsi(14)), rsi(14), lowerDonchian(20,rsi(14)));


      NOTE: For more information or questions on EFS2 visit the EFS 2 Development Forum

      Comment


      • #4
        T3 Average part 1

        The efs enclosed below is not really a study on study but it shows nonetheless how we can recycle the new EFS2 function efsInternal() multiple times making it behave as if it were a study on study.
        In this case we are going to use efsInternal() to calculate the T3 average. In order to do that we need to first create a "generalized double exponential moving average" (GD for short) which is done in the function GD() below function main().
        Then we need to run a GD of GD of GD which is done in main as a study of itself using efsInternal().

        PHP Code:
        function preMain() {
            
        setPriceStudy(true);
            
        setStudyTitle("T3 Avg");
            
        setCursorLabelName("T3");
        }

        var 
        bInit false;
        var 
        T3 null;

        function 
        main(Length,Factor) {

            if(
        Length==nullLength 6;
            if(
        Factor==nullFactor 0.7;//factor must be >0 and <=1

            
        if(bInit==false){
                
        T3 efsInternal("GD"LengthFactorefsInternal("GD"LengthFactorefsInternal("GD"LengthFactorclose())));
                
        bInit true;
            }
            
            return  (
        getSeries(T3));
        }

        function 
        GD(length,factor,source){

            var 
        Avg1 ema(length,source);
            var 
        Avg2 ema(length,getSeries(Avg1));
            
            if(
        Avg1.getValue(0)==null||Avg2.getValue(0)==null) return;
            
            var 
        X1 Avg1.getValue(0) * (factor);
            var 
        X2 Avg2.getValue(0) * factor;
         
            return (
        X1-X2);

        As a note of interest here below is the same study in EFS1. As for previous examples in this same thread you can instantly see how EFS2 makes programming a lot easier.
        For a fully customizable T3 average you can use the amT3MA.efs which is available here and that uses the amStudies Library available here together with its documentation. For more information on the amStudies Library see this thread.
        For more information and questions on EFS2 visit instead the EFS2 Development Forum
        Alex

        PHP Code:
        function preMain(){
            
        setPriceStudy(true);
            
        setStudyTitle("T3 Avg");
            
        setCursorLabelName("T3");
        }

        var 
        e1 0.0;
        var 
        e2 0.0;
        var 
        e3 0.0;
        var 
        e4 0.0;
        var 
        e5 0.0;
        var 
        e6 0.0;
        var 
        e1_1 0.0;
        var 
        e2_1 0.0;
        var 
        e3_1 0.0;
        var 
        e4_1 0.0;
        var 
        e5_1 0.0;
        var 
        e6_1 0.0;

        function 
        main(PricePeriods){

            if (
        Price == nullPrice "Close";
            if (
        Periods == nullPeriods 6;
            var 
        vPrice getValue(Price0);
            
            var 
        b  0.7;
            var 
        b2 b;
            var 
        b3 b;
            var 
        c1    = -b3;
            var 
        c2 b2 b3;
            var 
        c3 = -b2 b3;
            var 
        c4 b3 b2;
            var 
        f1 / (Periods 1);
            var 
        f2 f1;
            
            if (
        getBarState() == BARSTATE_NEWBAR){
                
        e1_1 e1;
                
        e2_1 e2;
                
        e3_1 e3;
                
        e4_1 e4;
                
        e5_1 e5;
                
        e6_1 e6;
            }
            
            
        e1 f1 vPrice f2 e1_1;
            
        e2 f1 e1 f2 e2_1;
            
        e3 f1 e2 f2 e3_1;
            
        e4 f1 e3 f2 e4_1;
            
        e5 f1 e4 f2 e5_1;
            
        e6 f1 e5 f2 e6_1;
            
            var 
        T3Average c1 e6 c2 e5 c3 e4 c4 e3;
            
            return 
        T3Average;

        Comment


        • #5
          Hi Alex,

          Very nice study and excellent example.

          Regards,

          Comment


          • #6
            Steve
            Thanks for the compliment. I agree that it is an interesting example especially if one considers that with only some very minor modifications this efs can be preset to run on multiple intervals/symbols and/or compute the T3 of any study that returns a series - whether eSignal or custom built - or be used as the source for any study that accepts a series (again both eSignal builtin or custom). All these variations would be very complex to program in EFS1
            Alex

            Comment


            • #7
              T3 Average part 2

              Following up on the T3 Average example posted in a prior message. That version was set to compute the T3 in a single time frame. If we wanted to make it available for multiple intervals the changes required would be minimal thanks to EFS2.
              In fact all we would need to do is add an interval parameter to the source in the following line

              PHP Code:
              T3 efsInternal("GD"LengthFactorefsInternal("GD"LengthFactorefsInternal("GD"LengthFactorclose()))); 
              changing it to the following to compute the indicator based on (for example) 5 minute data irrespective of the chart interval

              PHP Code:
              T3 efsInternal("GD"LengthFactorefsInternal("GD"LengthFactorefsInternal("GD"LengthFactorclose(inv(5))))); 
              What if we wanted to create a study on study using the T3, such as for example the T3 of RSI? Again thanks to the capabilities of EFS2 the solution is equally simple.
              Replace the same line with the following

              PHP Code:
              T3 efsInternal("GD"LengthFactorefsInternal("GD"LengthFactorefsInternal("GD"LengthFactorrsi(14)))); 
              Equally simple would be if we wanted to use the T3 as the source of a builtin such as for example the CCI. In this case the same line would simply be written as follows

              PHP Code:
              T3 cci(14,efsInternal("GD"LengthFactorefsInternal("GD"LengthFactorefsInternal("GD"LengthFactorclose())))); 
              As you can see EFS2 allows for relatively complex programming with a very easy syntax which is available to all.
              Alex

              Comment


              • #8
                McClellan Oscillator part 1

                Here is another study that clearly demonstrates how much EFS2 can simplify the task of programming.
                Following is a bare-bones version of the McClellan Oscillator set up to use exponential averages and summation. In this case I am using the builtin ema function to create the oscillator and taking advantage of the sym() function that allows any builtin study to directly reference an external symbol
                Alex

                PHP Code:
                function preMain() {
                    
                setStudyTitle("McClellan Oscillator"); 
                    
                setCursorLabelName("McClellan Osc");
                    
                setPlotType(PLOTTYPE_HISTOGRAM);
                }

                var 
                xInit    false;
                var 
                Avg1 null;
                var 
                Avg2 null;
                var 
                xOscSum  null;
                var 
                xOscSum1 null;
                  
                function 
                main(){

                    if(
                getBarState()==BARSTATE_ALLBARS){
                        
                xOscSum 0;
                    }
                    
                    if(
                xInit==false){
                        
                Avg1 ema(19,close(sym("$ADD")));
                        
                Avg2 ema(39,close(sym("$ADD")));
                        
                xInit=true;
                    }
                    if(
                Avg1.getValue(0)==null || Avg2.getValue(0)==null) return;
                    
                    var 
                xOsc = (Avg1.getValue(0) - Avg2.getValue(0));

                    if(
                getBarState()==BARSTATE_NEWBAR){
                        
                xOscSum1 xOscSum;
                        
                xOscSum  xOscSum1 xOsc;
                    }

                    return 
                xOscSum;


                For comparison purpose here is the same script in EFS1 syntax. Notice the difference in complexity with the EFS2 version.

                PHP Code:
                function preMain() {
                    
                setStudyTitle("McClellan Oscillator"); 
                    
                setCursorLabelName("McClellan Osc");
                    
                setPlotType(PLOTTYPE_HISTOGRAM);
                }

                var 
                vOsc null;
                var 
                vOsc_ret 0;
                var 
                vOsc_ret1 null;
                var 
                vADD null;
                var 
                aADD = new Array(39);

                function 
                main() {

                    var 
                nState getBarState();
                    
                    if (
                nState == BARSTATE_NEWBAR && vADD != null) {
                        
                aADD.pop();
                        
                aADD.unshift(vADD);
                        
                vOsc_ret1 vOsc_ret;
                    }
                    
                    
                vADD close(01"$ADD");
                    
                    if (
                vADD == null) return;
                    
                    
                aADD[0] = vADD[0];
                    
                    if (
                aADD[38] == null) return;
                    
                    
                vEMA[0] = EMA(190);
                    
                vEMA[1] = EMA(391);
                    
                vOsc vEMA[0] - vEMA[1];

                    
                vOsc_ret vOsc_ret1 vOsc;

                    return 
                vOsc_ret;
                }

                var 
                vEMA = new Array(2);
                var 
                vEMA1 = new Array(2);

                var 
                dPercent = new Array(2)
                dPercent[0] = null;
                dPercent[1] = null;

                var 
                bPrimed = new Array(2);
                bPrimed[0] = false;
                bPrimed[1] = false;

                function 
                EMA(nLengthnNum) {

                    var 
                nBarState getBarState();
                    var 
                dSum 0.0;
                    var 
                dRef;

                    if(
                dPercent[nNum] == null) {
                        
                dPercent[nNum] = (2.0 / (nLength 1.0));
                        
                bPrimed[nNum] = false;
                    }

                    if (
                nBarState == BARSTATE_NEWBAR) {
                        
                vEMA1[nNum] = vEMA[nNum];
                    }

                    if(
                bPrimed[nNum] == false) {
                        for(
                0nLengthi++) {
                            
                dSum += aADD[i];
                        }
                        
                bPrimed[nNum] = true;
                        return (
                dSum nLength);
                    } else {
                        return (((
                vADD vEMA1[nNum]) * dPercent[nNum]) + vEMA1[nNum]);
                    }

                Comment


                • #9
                  McClellan Oscillator part 2

                  Follows from the prior post.
                  Where EFS2 really comes into play is if we now want to take the same McClellan Oscillator formula and for example plot a moving average of the indicator or set it up for use with multiple intervals. In EFS1 these tasks would be beyond the reach of many but in EFS2 they require only a few very simple changes and a couple of lines of code.
                  For the purpose of this example assume that we would like to plot the ema of the Oscillator. To do this we need to make a series out of the oscillator so that we can then use it as the source of a builtin (by means of the efsInternal() function)
                  To accomplish this I will move out of main and into a separate function all the calculations required to compute the McClellan Oscillator.
                  Then in main I simply use the efsInternal() function to retrieve the oscillator value as a series This is so that I can plot also the oscillator besides its moving average. If I did not need to plot the oscillator I would just use efsInternal() directly as the source of the builtin moving average.
                  Lastly I add a builtin moving average study using the oscillator as the source.
                  Following is the code with all these changes. As you can see all that was necessary was to add three lines of code.
                  Alex

                  PHP Code:
                  function preMain() {
                      
                  setStudyTitle("McClellan Oscillator"); 
                      
                  setCursorLabelName("McClellan Osc",0);
                      
                  setCursorLabelName("MA",1);
                      
                  setDefaultBarFgColor(Color.blue,0);
                      
                  setDefaultBarFgColor(Color.red,1);
                      
                  setPlotType(PLOTTYPE_HISTOGRAM,0);
                  }

                  function 
                  main() {

                      var 
                  mcClellanOsc efsInternal("calc");//this calls the external function
                      
                  var movAvg      ema(10,getSeries(mcClellanOsc));//computes the ma using custom source

                      
                  return new Array (mcClellanOsc,movAvg);
                  }

                  var 
                  xInit    false;
                  var 
                  Avg1 null;
                  var 
                  Avg2 null;
                  var 
                  xOscSum  null;
                  var 
                  xOscSum1 null;
                    
                  function 
                  calc(){

                      if(
                  getBarState()==BARSTATE_ALLBARS){
                          
                  xOscSum 0;
                      }
                      
                      if(
                  xInit==false){
                          
                  Avg1 ema(19,close(sym("$ADD")));
                          
                  Avg2 ema(39,close(sym("$ADD")));
                          
                  xInit=true;
                      }
                      if(
                  Avg1.getValue(0)==null || Avg2.getValue(0)==null) return;
                      
                      var 
                  xOsc = (Avg1.getValue(0) - Avg2.getValue(0));

                      if(
                  getBarState()==BARSTATE_NEWBAR){
                          
                  xOscSum1 xOscSum;
                          
                  xOscSum  xOscSum1 xOsc;
                      }

                      return 
                  xOscSum;


                  Comment


                  • #10
                    McClellan Oscillator part 3

                    To complete the example on the McClellan Oscillator here is a customizable version of the indicator that allows to use simple or exponential averages in the calculation of the oscillator and includes a switch to plot the raw oscillator or the summation index. It also includes an option to use $ADD or $ADDQ
                    In this version of the McClellan Oscillator instead of calculating the oscillator by using two averages I am using the Price Oscillator included in the amStudies Function Library (see this post and thread for more information on the amStudies Library)
                    Copy of this efs is also available here. Version 7.9 beta1 or later and the amStudies.efsLib Library are required to run this study.
                    Alex

                    Attached Files

                    Comment


                    • #11
                      Chaikin Oscillator part 1

                      Here is another example that illustrates how we can easily create nested studies on studies using EFS2 syntax. This example also showcases another feature that was introduced with EFS2 and that is the Function Libraries. In this study I am using the dsDiffSeries() function written by Chris Kryza and included in his dsFunctions library.
                      This function computes the difference between two series and returns that result as a series
                      The following script computes the Chaikin Oscillator with its moving average.

                      PHP Code:
                      function preMain(){
                          
                      setStudyTitle("Chaikin Osc");
                          
                      setCursorLabelName("Osc",0);
                          
                      setCursorLabelName("MA",1);
                          
                      setDefaultBarFgColor(Color.blue,0);
                          
                      setDefaultBarFgColor(Color.red,1);
                      }    
                       
                      var 
                      myLib addLibrary("dsFunctions.efsLib");
                      var 
                      xChaikin null;
                      var 
                      xMAofChaikin null
                       
                      function main(Fast,Slow,Smooth){
                       
                          if(
                      Fast==nullFast 3;
                          if(
                      Slow==nullSlow 10;
                          if(
                      Smooth==nullSmooth 10;
                       
                          if(
                      xChaikin==nullxChaikin myLib.dsDiffSeries(ema(Fast,accDist()), ema(Slow,accDist()))
                          if(
                      xMAofChaikin==nullxMAofChaikin sma(Smooth,xChaikin);
                          
                          return new Array (
                      xChaikin.getValue(0),xMAofChaikin.getValue(0));

                      As you can see I am using the dsDiffSeries() function to compute the difference between two exponential averages each one based on another study ie Accumulation/Distribution. Because dsDiffSeries() returns a series I can then use it as a source for the sma() builtin study to compute a simple moving average of the oscillator.
                      Note that the to run this efs you need to have the dsFunction.efsLib file in the FunctionLibrary folder of eSignal. You can find the latest version of the library here
                      Alex

                      Comment


                      • #12
                        Chaikin Oscillator part 2

                        Continues from the prior post.

                        Even if we did not have available the dsDiffSeries() function it would still be very easy to create the Chaikin Oscillator study with its moving average.
                        What we need to do in that case is first create a separate function in which we will compute the oscillator

                        PHP Code:
                        var xFast null;
                        var 
                        xSlow null;
                         
                        function 
                        calcOsc(){
                            if(
                        xFast==nullxFast ema(3,accDist());//calculate the individual EMA of AccDist
                            
                        if(xSlow==nullxSlow ema(10,accDist());//as above
                            
                            
                        return (xFast.getValue(0)-xSlow.getValue(0));//compute the oscillator

                        Once we have the oscillator we can then call that function from main using efsInternal(). This will create the series that we will then use as a source for the SMA of the Oscillator. The code below shows the required steps. The result will be identical to the one showed in the image enclosed to the prior post
                        For a description of the efsInternal() function and other examples on how to use it see also this thread.
                        Alex

                        PHP Code:
                        function preMain(){
                            
                        setStudyTitle("Chaikin Osc");
                            
                        setCursorLabelName("Osc",0);
                            
                        setCursorLabelName("MA",1);
                            
                        setDefaultBarFgColor(Color.blue,0);
                            
                        setDefaultBarFgColor(Color.red,1);
                        }    
                         
                        var 
                        xChaikin null;
                        var 
                        xMAofChaikin null
                         
                        function main(){
                         
                            var 
                        xChaikin efsInternal("calcOsc");//this calls the separate function and creates the series
                            
                        var xMAofChaikin sma(10,xChaikin);//this computes the SMA of the oscillator
                            
                            
                        return new Array (xChaikin.getValue(0),xMAofChaikin.getValue(0));
                        }
                         
                        //this is the separate function that computes the oscillator
                        var xFast null;
                        var 
                        xSlow null;
                         
                        function 
                        calcOsc(){
                            if(
                        xFast==nullxFast ema(3,accDist());//calculate the individual EMA of AccDist
                            
                        if(xSlow==nullxSlow ema(10,accDist());//as above
                            
                            
                        return (xFast.getValue(0)-xSlow.getValue(0));//compute the oscillator

                        Comment


                        • #13
                          IE/2 average using efsExternal() part 1

                          In this example I will be showing how we can use the efsExternal() function to combine multiple EFSs to create an indicator.
                          Some of the advantages to using the efsExternal() function instead of merging the separate EFS into a single script are that we are less likely to introduce logic or syntax errors due to naming of the variables, incorrect placement of the code, etc and more importantly that it is easier to write the script.
                          The indicator we will be writing is the IE/2 Average which was developed by Tim Tillson and is the precursor to the T3 Average mentioned earlier in this same thread.
                          To compute this indicator we need two components, the ILRS or Integral Linear Regression Slope (which is the sum of a Simple Moving Average and the Linear Regression Slope) and the EPMA or End Point Moving Average (aka Linear Regression or LSMA).
                          The formula for the IE/2 average is ((SMA+LRS)+EPMA)/2
                          For the purpose of this example we will be using the following two formulas that are basic versions of the Linear Regression (LR.efs) and the Linear Regression Slope (LRS.efs). Both these scripts are fully functional on their own. Copy them into a Formula Editor window and save them in the same folder as LR.efs and LRS.efs

                          This is the LR.efs
                          PHP Code:
                          function preMain(){
                              
                          setPriceStudy(true);
                          }
                          function 
                          main(length,source) { 
                              if(
                          length==nulllength 10;
                              if(
                          source==nullsource close();
                              else 
                          source = eval(source);//see Notes in the IE/2 script
                              
                          var sum 0;
                              if (
                          source.getValue(-(length)) == null){
                              return;
                              }
                           for (var 
                          i=lengthi>0i--){
                                  
                          sum += (i-(length+1)/3)*source.getValue(i-(length)); 
                              }
                              var 
                          LR 6/(length*(length+1))*sum;
                              return (
                          LR);
                          }
                           
                          //Notes:
                          //If you are using this formula as a standalone efs and want to change
                          //the source in Edit Studies you need to write it as high(), hl2(), etc 
                          This is the LRS.efs
                          PHP Code:
                          function preMain(){
                              
                          setPriceStudy(false);
                          }
                          function 
                          main(length,source){ 
                              if(
                          length==nulllength 10;
                              if(
                          source==nullsource close();
                              else 
                          source = eval(source);//see Notes in the IE/2 script
                              
                          if(getCurrentBarCount()<length) return;
                              var 
                          Sum1 0;
                              var 
                          Sum2 0;
                              var 
                          SumBars length*(length-1)*.5;   
                              var 
                          SumSqBars = (length-1)*length*(2*length-1)/6;
                              for(var 
                          i=0i<lengthi++) {
                                  
                          Sum1 Sum1+i*source.getValue(-i);
                                  
                          Sum2 += source.getValue(-i);
                              }
                              var 
                          Sum3 SumBars*Sum2;
                              var 
                          Num length*Sum1-Sum3;   
                              var 
                          Den SumBars*SumBars-length*SumSqBars;    
                              if (
                          Den != 0) {
                                  var 
                          LRS Num/Den;
                           }
                           return (
                          LRS);
                          }
                          //Notes:
                          //If you are using this formula as a standalone efs and want to change
                          //the source in Edit Studies you need to write it as high(), hl2(), etc 
                          At this point we can write the formula for the IE/2 average in which we will use the efsExternal() function to call each formula and pass the required parameters. Comments are included in the script and the result is shown in the image enclosed below.
                          Copy the script in the Formula Editor window and save it with a name of your choice in the same folder in which you saved the other two formulas.
                          For more information on the efsInternal() function together with additional more examples see this thread.
                          Alex

                          PHP Code:
                          function preMain() {
                              
                          setPriceStudy(true);
                              
                          setStudyTitle("IE/2");
                              
                          setCursorLabelName("IE/2",0);
                          }
                           
                          //declare global variables
                          var bInit false;
                          var 
                          xMA null;
                          var 
                          xLRS null;
                          var 
                          xLR null;
                          //end declaring global variables
                           
                          function main(Length,Source){
                           
                              
                          //intialize the parameters - note you could execute this once only to make it more efficient
                              
                          if(Length==nullLength 15;//assign the Length if null
                              
                          if(Source==nullSource close();//assign the Source if null
                              
                          else Source = eval(Source);//else assign the Source in Edit Studies (see Notes below)
                              //end initializing parameters
                              //initialize studies
                              
                          if(bInit==false){
                                  
                          xMA sma(LengthSource);
                                  
                          xLR efsExternal("LR.efs",Length,Source);//call the efs and pass the parameters
                                  
                          xLRS efsExternal("LRS.efs",Length,Source);//call the efs and pass the parameters
                                  
                          bInit=true;
                              }
                              
                          //end intializing studies
                              
                              //declare the local variables and assign the values
                              
                          var nMA xMA.getValue(0);
                              var 
                          nLRS xLRS.getValue(0);
                              var 
                          nLR xLR.getValue(0);
                              
                          //end declaring local variables
                              
                              
                          if(nMA==null || nLRS==null || nLR==null) return;//null check
                              
                              
                          var IE2 = ((nLRS+nMA)+nLR)/2;//calculate the IE/2 average
                              
                              
                          return (IE2);
                          }
                           
                          //Notes:
                          //When inputting a Source in Edit Studies use high(), hl2(), etc.
                          //Because these will be strings ie "high()", "hl2()" etc we use the eval() function 
                          //in line 19 to evaluate that string in other words to read it as if it were written
                          //without the quotes "". For more information on the eval() function see the article
                          //in the Core JavaScript Guide in the EFS KnowledgeBase (link provided below) 
                          Link to eval() article


                          Comment


                          • #14
                            IE/2 average using efsExternal() part 2

                            (continues from prior post)

                            In all three scripts included in the prior message one can also use any builtin study as the source and input that directly in the Edit Studies dialog box. All that is required is to be familiar with the syntax of the builtin studies. For the required syntax see the EFS2 Function Reference-> Built-in Studies in the EFS KnowledgeBase
                            So, if for example we wanted to compute the Linear Regression Slope of the RSI of the (High+Low)/2 we just need to input rsi(14,hl2()) in the source field of the Edit Studies window of the LRS.efs (see image below)
                            Alex


                            Comment


                            • #15
                              IE/2 average using efsExternal() part 3

                              (continues from prior post)

                              To complete this example - and to show how the efsExternal() function allows us to easily write an efs using separate formulas as modular blocks - I am going to assume that we would like to compute the IE/2 average of another indicator.
                              For the purpose of this example I am going to use a simple version of the CCI study that is enabled to receive length and source as the parameters. Copy the following code into a new Formula Editor window and save the script as CCI.efs in the same location in which you saved the prior examples

                              PHP Code:
                              function preMain() {
                                  
                              setPriceStudy(false);
                                  
                              setStudyTitle("CCI");
                                  
                              setCursorLabelName("CCI"0);
                              }
                               
                              var 
                              CCI null;
                               
                              function 
                              main(length,source) {
                                  if(
                              length==nulllength 20;
                                  if(
                              source==nullsource close();
                                  else 
                              source = eval(source);
                                  if(
                              CCI==nullCCI cci(length,source);
                               
                                  return 
                              CCI.getValue(0);

                              At this point we will modify the original IE/2.efs to now call this CCI.efs and use it as the source for its calculations.
                              The end result will be as shown in the following schematic


                              Following is the IE/2 average formula now modified to use an external efs as the source. Comments showing the modifications are included in the script. Copy and save the script in the same location as the other supporting efs.
                              Alex

                              PHP Code:
                              function preMain() {
                                  
                              setPriceStudy(false);//changed to non price study
                                  
                              setStudyTitle("IE/2");
                                  
                              setCursorLabelName("IE/2",0);
                              }

                              var 
                              bInit false;
                              var 
                              xMA null;
                              var 
                              xLRS null;
                              var 
                              xLR null;
                              var 
                              xCCI null;//added global variable for CCI
                               
                              function main(Length,CCILength,Source){//added definition for CCILength parameter
                                  
                                  
                              if(Length==nullLength 15;
                                  if(
                              CCILength==nullCCILength 14;//added intialization of CCILength parameter
                                  
                              if(Source==nullSource close();
                                  else 
                              Source = eval(Source);
                                  
                                  if(
                              bInit==false){
                                      
                              xCCI efsExternal("CCI.efs",CCILength,Source);//calling external CCI study and passing parameters
                                      
                              xMA sma(LengthxCCI);//changed source to xCCI series
                                      
                              xLR efsExternal("LR.efs",Length,xCCI);//changed source to xCCI series
                                      
                              xLRS efsExternal("LRS.efs",Length,xCCI);//changed source to xCCI series
                                      
                              bInit=true;
                                  }
                               
                                  var 
                              nMA xMA.getValue(0);
                                  var 
                              nLRS xLRS.getValue(0);
                                  var 
                              nLR xLR.getValue(0);
                                  
                                  if(
                              nMA==null || nLRS==null || nLR==null) return;
                                  
                                  var 
                              IE2 = ((nLRS+nMA)+nLR)/2;
                                  
                                  return (
                              IE2);


                              Note: All the examples provided in this thread are primarily intended to illustrate the functionality and the basic construct of these new EFS2 functions and are not necessarily written in the most efficient way
                              If you search through the forums you will find many threads [complete with examples] that discuss how to use them efficiently

                              Comment

                              Working...
                              X