Announcement

Collapse
No announcement yet.

Question with the function getDay()

Collapse
X
 
  • Filter
  • Time
  • Show
Clear All
new posts

  • Question with the function getDay()

    Hello,
    I try to code something and I need to know the number of the day into the week. As usual for the computer :
    0 for sunday, 1 for monday, etc... 7 for saturday.
    So, in the documentation I read that the function getDay() is the right to doing that.
    But, when I use it, the answer is the number (of the day) into the month. For example today, I obtain : 20 because we are the 20 of february. Ok, but I know I have another function for that (as gateDate).
    after that, my program is very simple.
    just a question using this function as result of a variable
    myvar = getDay(0).
    and to obtain the currentbarindex when it is a week change
    if (getDay(0) < getDay(-1)){...}

    Please, if anybody would help me ?
    thank you
    Mermoz
  • #2
    Re: problem with the function getDay() and the official documentation

    Mermoz
    The function getDay() or day() return the day of the month of the bar being processed. For information on these functions see the links to the corresponding articles in the EFS KnowledgeBase
    The getDay() you are referring to which returns the day of the week is instead a method of the Date Object (see the link to the article in the EFS KnowledgeBase)
    Alex


    Originally posted by Mermoz_2et
    Hello,
    I try to code something and I need to know the number of the day into the week. As usual for the computer :
    0 for sunday, 1 for monday, etc... 7 for saturday.
    So, in the documentation I read that the function getDay() is the right to doing that.
    But, when I use it, the answer is the number (of the day) into the month. For example today, I obtain : 20 because we are the 20 of february. Ok, but I know I have another function for that (as gateDate).
    after that, my program is very simple.
    just a question using this function as result of a variable
    myvar = getDay(0).
    and to obtain the currentbarindex when it is a week change
    if (getDay(0) < getDay(-1)){...}

    Please, if anybody would help me ?
    thank you
    Mermoz
    Comment


    • #3
      Mermoz
      Here is one way you can identify a new week using the getDay() method.
      Declare two global variables (ie outside of the main function) called [for example] prevDOW and currDOW and set them intiially to a value of 0. These variables will be used to store the prior day of the week and the current day of the week.
      Then in the main function use the sample code enclosed below.
      PHP Code:
      var barDate getValue("time");//create a date object using the bar's date
      if(getBarState()==BARSTATE_NEWBAR && day(0)!=day(-1)){//at every change of date
          
      prevDOW currDOW;//assign to prevDOW the last known value of currDOW 
          
      currDOW barDate.getDay();//assign to currDOW the current day of the week
          
      if(currDOW prevDOW) {//if currDOW is less than prevDOW [ie it is a Sunday or Monday]
              //rest of your code
          
      }

      Alternatively you could just look for BARSTATE_NEWBAR on the weekly interval using the getBarStateInterval() function (see the link to the corresponding article in the EFS KnowledgeBase)
      PHP Code:
      if(getBarStateInterval("w")==BARSTATE_NEWBAR){//at every first tick of a weekly bar
          //rest of your code

      Either way should allow you to determine a change in week
      Alex

      Comment


      • #4
        Thank you, Alexis, for your answers, especially the last one.
        I tried to code it with the key-word : getBarStateInterval, but nothing happens!
        Perhaps I made a mistake in my code.
        To make sure, I have a question:
        When I search that word "getBarStateInterval" with the f(x) button in the efs window tool, I can't find it. Is it normal?
        For your information, I loaded the last version of eSignal.
        Do I have to do something to use this new key-word "getBarStateInterval" ? Is it possible to use it directly within the main function, or within a home-made function ?
        Thanks in advance for your answer,
        Mermoz.

        Comment


        • #5
          Mermoz
          I am not sure what you are referring to when you say "nothing happens" ie that no hints are appearing when you type the word in the Editor or if the function is not working
          If the former then that seems to be because it has yet to be added to the formula keywords. This does not prevent you from being able to use it. For the description and syntax of the function see the link I provided in my previous reply.
          If the latter then it could be an error in your code as it appears to be working at my end
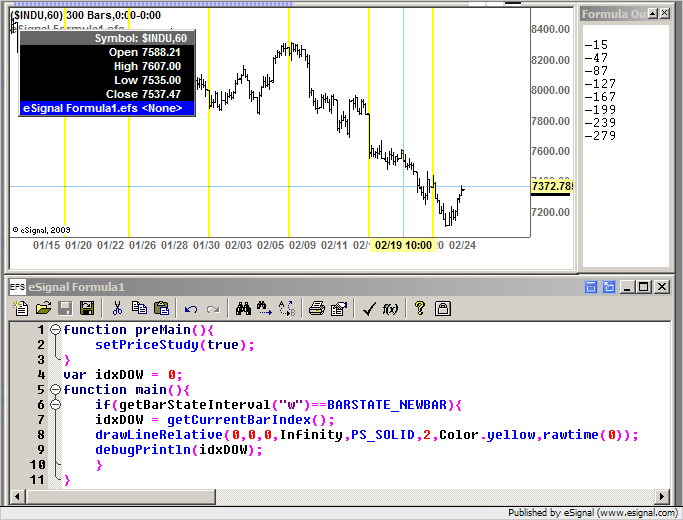
          In the following screenshot you can see that I am painting each first bar of the week using the code sample I provided and in the debug window you can see the bar indexes corresponding to those bars
          You can use it in the main or any custom function


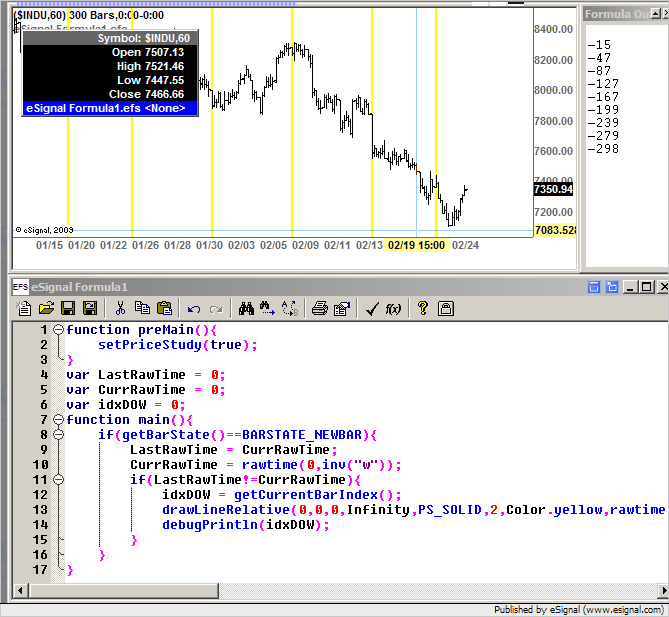
          Keep in mind that there are also other ways to determine the beginning of a week including checking for a change of rawtime() based on the weekly interval (see the example in the screenshot enclosed below).
          Alex


          Originally posted by Mermoz_2et
          Thank you, Alexis, for your answers, especially the last one.
          I tried to code it with the key-word : getBarStateInterval, but nothing happens!
          Perhaps I made a mistake in my code.
          To make sure, I have a question:
          When I search that word "getBarStateInterval" with the f(x) button in the efs window tool, I can't find it. Is it normal?
          For your information, I loaded the last version of eSignal.
          Do I have to do something to use this new key-word "getBarStateInterval" ? Is it possible to use it directly within the main function, or within a home-made function ?
          Thanks in advance for your answer,
          Mermoz.

          Comment


          • #6
            Hi Alexis,
            thanks again. Perhaps after a reboot of my computer (after the download of the latest version ? I don't know), but it works! ... I mean your examples.
            I try to use the getCurrentBarIndex obtained, to read and plot the previous close of this bar, as follows :
            PHP Code:
            var etat 0;
            var 
            Idx 0;

            function 
            main(Color1Color2Color3Epaisseur) {

                if(
            getBarStateInterval("w") == BARSTATE_NEWBAR){
                    
            Idx getCurrentBarIndex();
                    
            etat close(Idx);
                }

                if(
            etat == null){
                    return;
                }

                return 
            etat;
            }{ 
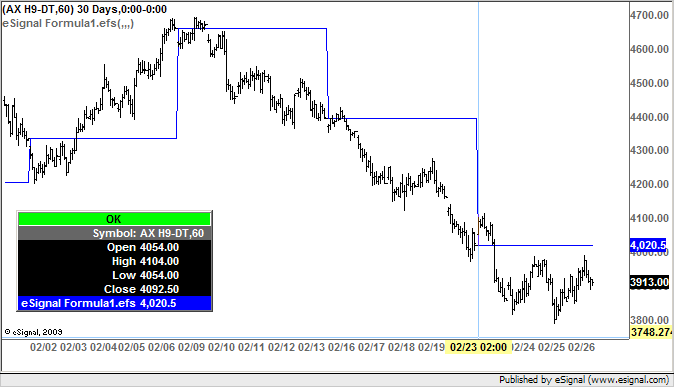
            and the result is on the attached image.
            So You can see my problem, I obtain 2 lines (in black) and I can't recognize the close of these weeks. In fact I don't know what I obtain !
            Attached Files

            Comment


            • #7
              Mermoz
              The function getCurrentBarIndex() returns the index of a bar relative to the most recent bar in the chart which has an index of 0. The bar index parameter used in the close() function is instead relative to the bar being processed.
              So if you pass Idx [to which you have assigned the value of getCurrentBarIndex()] to the close() function you are in effect requesting the value of the Close at Idx bars prior to the bar being processed at that time [while the formula runs through historical bars] and not the value of the Close at a specific bar index.
              If you want to retrieve the value of the last Close prior to a change of week you need to use close(-1). This is because BARSTATE_NEWBAR occurs on the first bar of the week hence the previous Close will be at bar index -1 relative to the bar being processed at that time while the formula runs through historical bars
              Here is how you would need to modify your formula (the resulting plot is shown in the image enclosed below).
              PHP Code:
              var etat 0;

              function 
              main(Color1Color2Color3Epaisseur) {

                  if(
              getBarStateInterval("w") == BARSTATE_NEWBAR){
                      
              etat close(-1);
                  }
                  
                  if(
              etat == null){
                      return;
                  }

                  return 
              etat;

              I am assuming that you are doing this to avoid using the weekly bar's Close which includes the Settlement else you could just use
              close(-1,inv("w"))
              which would return the prior week's Close based on the weekly bar
              Alex


              Originally posted by Mermoz_2et
              Hi Alexis,
              thanks again. Perhaps after a reboot of my computer (after the download of the latest version ? I don't know), but it works! ... I mean your examples.
              I try to use the getCurrentBarIndex obtained, to read and plot the previous close of this bar, as follows :
              PHP Code:
              var etat 0;
              var 
              Idx 0;

              function 
              main(Color1Color2Color3Epaisseur) {

                  if(
              getBarStateInterval("w") == BARSTATE_NEWBAR){
                      
              Idx getCurrentBarIndex();
                      
              etat close(Idx);
                  }

                  if(
              etat == null){
                      return;
                  }

                  return 
              etat;
              }{ 
              and the result is on the attached image.
              So You can see my problem, I obtain 2 lines (in black) and I can't recognize the close of these weeks. In fact I don't know what I obtain !

              Comment


              • #8
                Hello Alexis,
                thank you. It works well.
                but another difficulty is coming up with the utilisation of the index return by :
                PHP Code:
                if(getBarStateInterval("w") == BARSTATE_NEWBAR){
                  
                Idx getCurrentBarIndex();
                 } 
                the Interval may be "w" or "m" or "d", this is not the point.

                I just need to know the last value of this Index beginning the code. I can obtain that value in a loop on the price serie, but I need this value in the beginning of my code. So, I tried to place this within a efsInternal function. and it doesn't work.
                Is it possible to call a efsinternal function just to obtain this index?
                I try and would be happy if you read and correct my code :
                PHP Code:
                function main(){

                result myfunction()
                ...
                return ..
                }

                myfunction()
                   if(
                getBarStateInterval("w") == BARSTATE_NEWBAR){
                      
                Idx getCurrentBarIndex();
                   }
                   return 
                Idx;

                I don't find how to make a loop on the serie price within an efsInternal function
                Thanks in advance.
                Mermoz

                Comment


                • #9
                  Here is what I try to do, and perhaps several of us will be interested by that.

                  I use pivots points in daily, weekly and monthly intervals. But rapidly there is a forest of lines on my chart ! Not obvious on trading to focus my eyes on the useful line (which changes with the market, of course). So, in a first step I decided to represent just one period for each pivot point.
                  I precise :
                  the daily pivots just for the last day (the 5 lines : R2,R1,PP,S1,S2),
                  the weekly pivots just for the last week,
                  the monthy pivot just for the last month.

                  This is the reason I need to know, for each interval I use, the bar where the period changes. And perhaps it is a mistake, but it seems to me I need these changes before the loop on all the bar of my prices serie.
                  One another difficulty is I discovered if I use the key-word close() on a future contract in daily interval I obtain, not the close at 22h, (which I want use) but the settlement price ! and there is no function to distinguish the close and the settlement (perhaps a good innovation ?)
                  If anybody has suggestions ?
                  thank you.
                  Mermoz

                  Comment


                  • #10
                    Mermoz
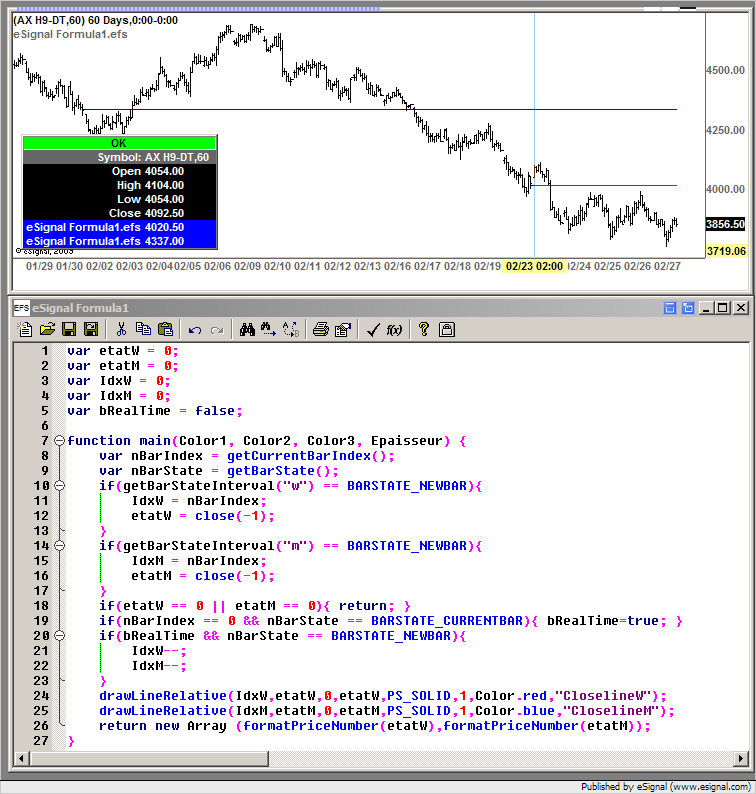
                    Assuming I understood you correctly the simplest solution in my opinion would be to draw the lines using the drawLineRelative() function rather than plotting the values. This would allow you to easily display only the current lines for each interval (daily, weekly, etc)
                    The following image illustrates an example of how to do this using the code logic discussed up to this point and displays the results in the chart


                    The only addition I made to the logic is to decrease the values of the IdxW and IdxM variables by 1 as each new bar is added to the chart in real time
                    As I explained earlier in this thread using getBarStateInterval() is one way of defining a new period of an external interval and you can accomplish the same results using rawtime() based on the corresponding interval as shown in a previous example. The required logic does not change
                    If for whatever reason you instead want to plot the values then there are other solutions available that would allow you to display the plots only for the current period of an interval. You can find an example of how to do this for the daily interval in this thread and for the weekly interval in this thread. As to the monthly interval you can accomplish that by slightly modifying the logic used for the daily
                    At this point I believe you should have sufficient information and examples available to allow you to develop an efs that will suit your requirements
                    Alex


                    Originally posted by Mermoz_2et
                    Here is what I try to do, and perhaps several of us will be interested by that.

                    I use pivots points in daily, weekly and monthly intervals. But rapidly there is a forest of lines on my chart ! Not obvious on trading to focus my eyes on the useful line (which changes with the market, of course). So, in a first step I decided to represent just one period for each pivot point.
                    I precise :
                    the daily pivots just for the last day (the 5 lines : R2,R1,PP,S1,S2),
                    the weekly pivots just for the last week,
                    the monthy pivot just for the last month.

                    This is the reason I need to know, for each interval I use, the bar where the period changes. And perhaps it is a mistake, but it seems to me I need these changes before the loop on all the bar of my prices serie.
                    One another difficulty is I discovered if I use the key-word close() on a future contract in daily interval I obtain, not the close at 22h, (which I want use) but the settlement price ! and there is no function to distinguish the close and the settlement (perhaps a good innovation ?)
                    If anybody has suggestions ?
                    thank you.
                    Mermoz

                    Comment


                    • #11
                      Thanks very much for your solution.
                      It works well !! and this code is very clean, very concise. I am working on it to include all the formulas of pivots points.
                      Just a little question if you have time; I try to understand the two lines
                      PHP Code:
                      21   IdxW--;
                      22   IdxM--; 
                      If I understand, you decrement by 1 these two variables. So you begin the draw of each line one more bar on the past (difficult to say that in english to me). I tried without this "decrementation" and found no diffference. Is it normal ?
                      Thanks in advance
                      Mermoz

                      Comment


                      • #12
                        Mermoz
                        Those lines of code are executed on each new bar only if bRealTime is true which occurs only when real time data has been received [ie at BARSTATE_CURRENTBAR on bar index 0]
                        So until new bars get added in real time those lines of code have no effect
                        Alex


                        Originally posted by Mermoz_2et
                        Thanks very much for your solution.
                        It works well !! and this code is very clean, very concise. I am working on it to include all the formulas of pivots points.
                        Just a little question if you have time; I try to understand the two lines
                        PHP Code:
                        21   IdxW--;
                        22   IdxM--; 
                        If I understand, you decrement by 1 these two variables. So you begin the draw of each line one more bar on the past (difficult to say that in english to me). I tried without this "decrementation" and found no diffference. Is it normal ?
                        Thanks in advance
                        Mermoz

                        Comment

                        Working...
                        X