 Tweet
Tweet
1. I have extended intraday history enabled.
2. I have a time template of 1250 days on a basic advanced chart set to 5 minutes. The chart goes back exactly 1250 days and the built in moving averages work.
3. I loaded the prev open.efs and it only goes back about 300 days.
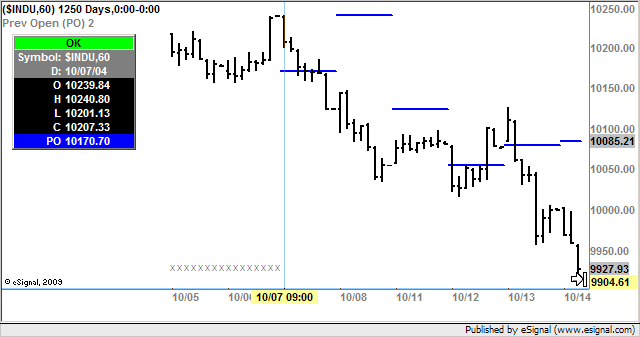
Below is the code of Formula/OHLC folder/Prev Open.efs with some debug code added. The text "Start" appears under the first bar of the chart and "x" appears under all the bars up until the study starts working.
Basically it seems that I am only getting 300 days of data for the open(inv("D")) Series Object even though the Time Template is set for 1250 days and the chart goes back 1250 days.
function preMain() {
setPriceStudy(true);
setStudyTitle("Prev Open (PO) 2");
setCursorLabelName("PO");
setDefaultBarStyle(PS_SOLID);
setDefaultBarFgColor(Color.blue);
setDefaultBarThickness(2);
setPlotType(PLOTTYPE_FLATLINES);
}
var bInit = false;
var xOpen = null;
function main() {
if(isMonthly() || isWeekly() || isDaily())
return;
if(bInit == false){
xOpen = open(inv("D"));
bInit = true;
drawText("Start", BottomRow1);
}
var vOpen = xOpen.getValue(-1);
if(vOpen == null){
drawText("X", BottomRow2);
return;
}
return (vOpen);
}
2. I have a time template of 1250 days on a basic advanced chart set to 5 minutes. The chart goes back exactly 1250 days and the built in moving averages work.
3. I loaded the prev open.efs and it only goes back about 300 days.
Below is the code of Formula/OHLC folder/Prev Open.efs with some debug code added. The text "Start" appears under the first bar of the chart and "x" appears under all the bars up until the study starts working.
Basically it seems that I am only getting 300 days of data for the open(inv("D")) Series Object even though the Time Template is set for 1250 days and the chart goes back 1250 days.
function preMain() {
setPriceStudy(true);
setStudyTitle("Prev Open (PO) 2");
setCursorLabelName("PO");
setDefaultBarStyle(PS_SOLID);
setDefaultBarFgColor(Color.blue);
setDefaultBarThickness(2);
setPlotType(PLOTTYPE_FLATLINES);
}
var bInit = false;
var xOpen = null;
function main() {
if(isMonthly() || isWeekly() || isDaily())
return;
if(bInit == false){
xOpen = open(inv("D"));
bInit = true;
drawText("Start", BottomRow1);
}
var vOpen = xOpen.getValue(-1);
if(vOpen == null){
drawText("X", BottomRow2);
return;
}
return (vOpen);
}
Comment