Announcement

Collapse
No announcement yet.

Stochastics ColorBar EFS

Collapse
X
 
  • Filter
  • Time
  • Show
Clear All
new posts

  • Stochastics ColorBar EFS

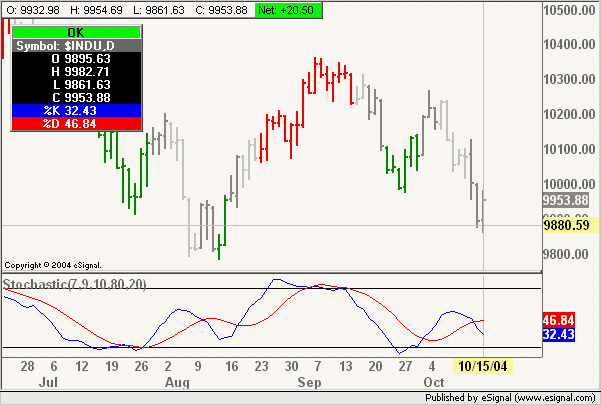
    I'm looking for an EFS study that paints bars as follows:

    If stochastics 7,9,10 is between 50 and 70 then grey, if greater than 70 then red; if between 30 and 50 dark grey, if less than 30 green

    Is there any such study or one that I can modify? Thanks in advance for a prompt response

  • #2
    TBond
    Which Stochastic, %K or %D?
    Alex

    Comment


    • #3
      stochastics wherein you enter a value for %k then abother for %k and then one for %D - in basics studies folder

      Comment


      • #4
        TBond
        I understand that but which of the two plots must be within the values you mentioned?
        Alex

        Comment


        • #5
          oops, sorry, the first %K

          Comment


          • #6
            TBond
            The attached efs should do what you want.
            Set the values of the Stochastic using Edit Studies.
            Alex

            Attached Files

            Comment


            • #7
              Alex,

              Thanks - I'll try it out. Sorry for the PM

              Comment


              • #8
                Alex,

                that works for the most part - thanks! just one refinement - i meant that I'd like color bands on the indicator when the condition is met. e.g., if >70 then a green vertical line is plotted on the indicator like the RSIColorLineBar indicator does. the EFS file you provided actually paints the price bars (which is what I incorrectly asked for :-)

                Comment


                • #9
                  TBond
                  Open the efs with the Editor (Tools->EFS->Editor in the main menu) and in lines 61-68 replace every instance of
                  setPriceBarColor(Color...)
                  with
                  setBarBgColor(Color....)
                  Alex

                  Comment


                  • #10
                    OK, did that - now two final things to clea it up.

                    1. I don't want any changes to my price bar colors - i plot candlesticks and use green for up and red for down. what should i change?

                    2. how do i change the color of the plotted stochastic indicator - to say, a line twice as think as the one plotted and dark blue?

                    thanks for all the assistance

                    Comment


                    • #11
                      TBond
                      1. In the preMain() section of the efs delete the lines
                      setColorPriceBars(true);
                      setDefaultPriceBarColor(Color.black);
                      2. Also in preMain() you will find the settings for the plots. For example the colors are defined by SetDefaultBarFgColor(Color.blue, 0) whereas the thickness is defined by SetDefaultBarThickness (1, 1). The second number in the settings corresponds to the element in the return array.
                      For the list of colors available as "plain language" click here. You can however create more colors/shades/hues by using the RGB values.
                      Alex

                      Comment


                      • #12
                        ok, where can i get info on variable names for colors as well as type of colors (solid, transparent, hatched, etc)

                        Comment


                        • #13
                          TBond
                          See my prior reply
                          Alex

                          Comment


                          • #14
                            yeah, clicked on that link and I got a sessiontimeout message. i use mozilla firefox.

                            copied properties of link to IE6 and tried and it works -

                            sorry, that was reason i sent other message - link did not work

                            Comment


                            • #15
                              Alexis, I downloaded the indicator you have listed in this thread and liked it, however, wondered if a few modifications could be made...I'm a new user so I don't program this stuff well yet !
                              1. How can it be set up so the user could input custom oversold and overbought levels? 2. Can the user input their own color preference 3. User input on what output to track...% K OR %D
                              4. User input of custom time periods 5. And most importantly, can it be configured so the stochastic indicator does not show in the study window, I want it just to change the colors of the price plot.

                              Thanks
                              GM

                              Comment

                              Working...
                              X