 Tweet
Tweet
Hello,
I try to code something and I need to know the number of the day into the week. As usual for the computer :
0 for sunday, 1 for monday, etc... 7 for saturday.
So, in the documentation I read that the function getDay() is the right to doing that.
But, when I use it, the answer is the number (of the day) into the month. For example today, I obtain : 20 because we are the 20 of february. Ok, but I know I have another function for that (as gateDate).
after that, my program is very simple.
just a question using this function as result of a variable
myvar = getDay(0).
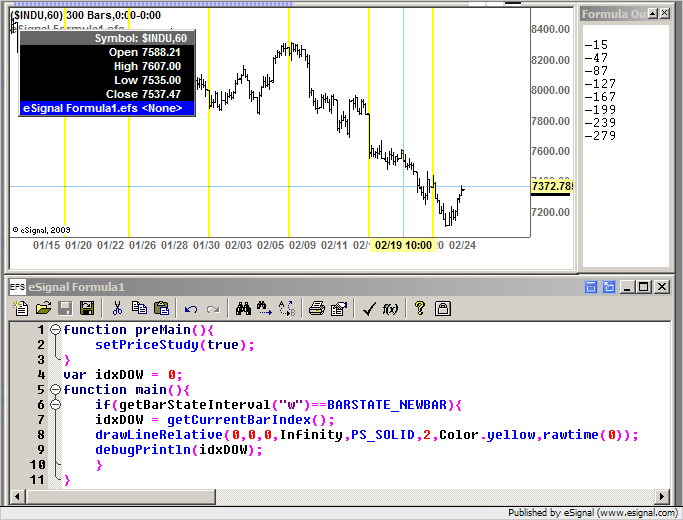
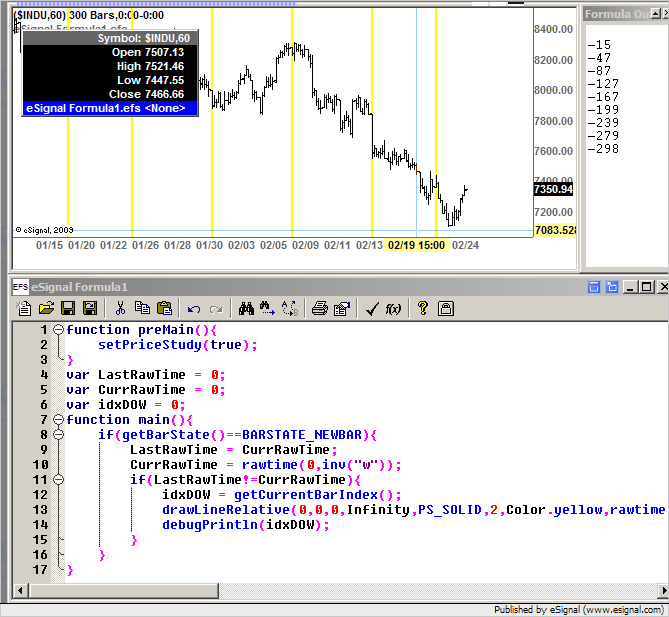
and to obtain the currentbarindex when it is a week change
if (getDay(0) < getDay(-1)){...}
Please, if anybody would help me ?
thank you
Mermoz
I try to code something and I need to know the number of the day into the week. As usual for the computer :
0 for sunday, 1 for monday, etc... 7 for saturday.
So, in the documentation I read that the function getDay() is the right to doing that.
But, when I use it, the answer is the number (of the day) into the month. For example today, I obtain : 20 because we are the 20 of february. Ok, but I know I have another function for that (as gateDate).
after that, my program is very simple.
just a question using this function as result of a variable
myvar = getDay(0).
and to obtain the currentbarindex when it is a week change
if (getDay(0) < getDay(-1)){...}
Please, if anybody would help me ?
thank you
Mermoz
Comment