Announcement

Collapse
No announcement yet.

Tick indicator study ?

Collapse
X
 
  • Filter
  • Time
  • Show
Clear All
new posts

  • Tick indicator study ?

    Can someone help me build a simple indicator that tracks the tick using a line rather than a bar ?
    Thanks

  • #2
    Hello sgrabs,

    Try changing your chart type to "Line." Is this what you needed?


    Jason K.
    Project Manager
    eSignal - an Interactive Data company

    EFS KnowledgeBase
    JavaScript for EFS Video Series
    EFS Beginner Tutorial Series
    EFS Glossary
    Custom EFS Development Policy

    New User Orientation

    Comment


    • #3
      Im sorry , i meant study...

      Sorry Jason, yes you are obviously correct that changing to line would suffice. I found your study for tick extremes, but i was hoping to get a study that had the tick as a line study.

      Thanks again.
      sg

      Comment


      • #4
        Hello sgarbs,

        Try this out. I modified the TickExtremes.efs to draw the close of the $Tick as a line by changing line 12 to a plot type of "PLOTTYPE_LINE" from "PLOTTYPE_FLATLINES."

        line 12: setPlotType(PLOTTYPE_LINE, 2);


        TickExtremesLine.efs

        Jason K.
        Project Manager
        eSignal - an Interactive Data company

        EFS KnowledgeBase
        JavaScript for EFS Video Series
        EFS Beginner Tutorial Series
        EFS Glossary
        Custom EFS Development Policy

        New User Orientation

        Comment


        • #5
          Thanks Jason

          Is there any way to get rid of the ohl & only use the close point as the plot point in the line ?

          Comment


          • #6
            Sure, try this one.

            TickExtremesLine2.efs
            Jason K.
            Project Manager
            eSignal - an Interactive Data company

            EFS KnowledgeBase
            JavaScript for EFS Video Series
            EFS Beginner Tutorial Series
            EFS Glossary
            Custom EFS Development Policy

            New User Orientation

            Comment


            • #7
              tick extremes on tick charts

              hi,

              love the tick extremes efs on minute charts.
              it just doesn't want to do it on tick charts. the bars in the efs display are all the same length going from about + 1000 to -1000 !?!
              the last and close work, just as soon as a new bar is drawn it gets the HL of about +- 1000.
              any idea ?

              Comment


              • #8
                Hello Matt,

                I'm not sure I understand the problem. On a tick interval, the open, high, low and close will all be the same value. So you shouldn't see any HL bars on a tick interval.


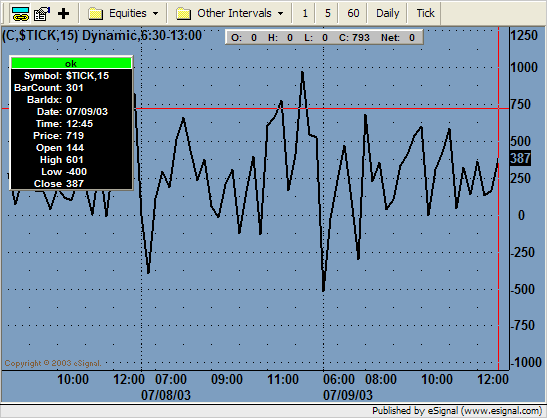
                This image is using TickExtremes.efs. Are we talking about the same formula? Please post an image of what you are seeing so I can have a better understanding of the problem.
                Jason K.
                Project Manager
                eSignal - an Interactive Data company

                EFS KnowledgeBase
                JavaScript for EFS Video Series
                EFS Beginner Tutorial Series
                EFS Glossary
                Custom EFS Development Policy

                New User Orientation

                Comment


                • #9
                  hi jason,

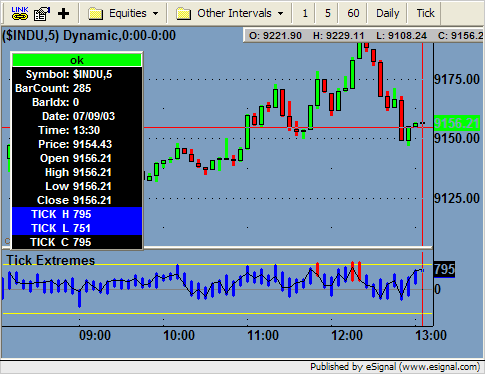
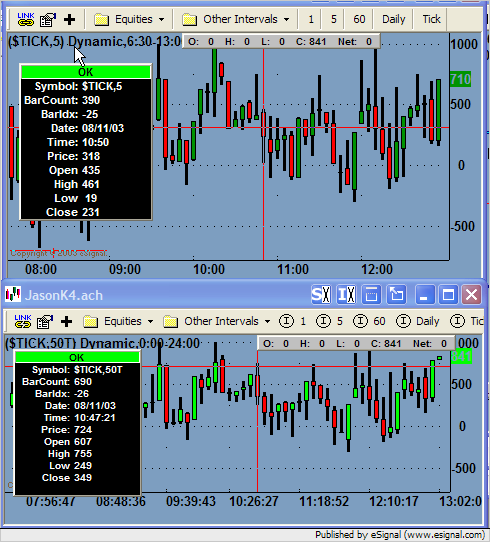
                  I guess I wasn't too clear. here is an image of 5 min bar on the es. I'll post a 800t es right after. not sure it will fit into this message. the 800 tick chart is "close" to a 5 min chart. yet the tick extremes efs looks totally different.
                  Attached Files

                  Comment


                  • #10
                    here is the 800 tick image.

                    thanks
                    Attached Files

                    Comment


                    • #11
                      Adv $tick study help ?

                      Hi guys...
                      I am trying to do the following:

                      Im using a 110 tic interval for my symbol (es u3) & want to get the $tick on the study pane where it has the following attributes:

                      1. In the form of a histogram
                      2. Bar colors :Orange when >500< reading; Green>500 & Red <500.
                      3. When $ticki reading is +/- 24 : Allow the same $tick Bar to spike Blue from the $tick reading level up to 1000 or if negative -down to -1000.

                      4. $tick interval is independent of Symbol interval and only creates new bar for each reading. So if symbol (es u3)has high volume ... it will have multiple 110tic bars without any new $tick bar in the study pane - essentially leaving gaps & bunching depending upon the symbols volume.

                      I guess thats it ... i hope im not asking for a miracle - but the tickextremes.efs doesnt allow for number 4 above. It seems to be tied in with the 120 tic interval which defeats the purpose of what im trying to do - which is measure spikes in volume.

                      Thanks
                      sg

                      Comment


                      • #12
                        hi jason,

                        did you have a chance yet to look at my images ? I would love to use it for tick intervals. hope you find a fix.

                        thanks

                        ps.
                        sg your idea sounds intriguing.

                        Comment


                        • #13
                          intriguing but not do-able i guess ...

                          <Matt
                          I wish i had listened to my mom & become a javascript programmer :-)
                          Im kinda helpless in this arena & the wizard doesnt work too well with this type of complication.


                          I guess ill have to stick with ticki extremes in 1 min rather than in a 110 tic interval (it doesnt work).

                          Comment


                          • #14
                            Hello Matt,

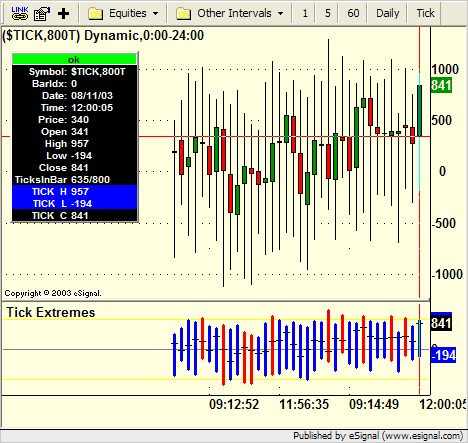
                            I think the formula, TickExtremes.efs is working properly on a 800T interval. Bring up a chart of $TICK with an 800T interval and then apply the formula. The HLC from the formula is matching the HLC data of $TICK in the price window.

                            I think that your 800T interval doesn't really match up well with a 5 min interval. If you look at the start times of the price bars of $TICK on the 800T interval, each bar is covering well over an hour.


                            Looks to me like a 50T interval is closer to the 5 min interval. Compare two charts, one with a 50T and the other on a 5 min. Notice the bar times are much closer and consequently the HLC pattern is much closer. Hope this helps.

                            Jason K.
                            Project Manager
                            eSignal - an Interactive Data company

                            EFS KnowledgeBase
                            JavaScript for EFS Video Series
                            EFS Beginner Tutorial Series
                            EFS Glossary
                            Custom EFS Development Policy

                            New User Orientation

                            Comment


                            • #15
                              hi jason,

                              I guess I've created a little bit of a confusion.
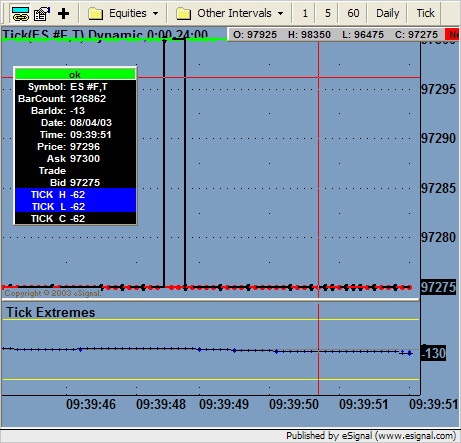
                              my image is a 800 tick chart of the s+p emini.
                              a 800 tick es chart is somewhere between 2-3 minutes at the open and 5-8 minutes at the close.
                              so a comparison of a 5 min es chart and a 700 or 800 tick es chart is making sense .
                              if you have a strong up bar in the es using 800 ticks it may only take 1 minute or less, yet the tickextremes gives me quite often a high low reading of +and - 1000 for that 1 minute bar !
                              there is no way you have a low of - 1000 reading during a strong up move.
                              if you look at my charts you can clearly see that the es 800 tick interval has a lot of +-1000 tickextremes readings with a strong up or down candle. no such thing with the 5 min es chart.
                              just to reiterate I am not using $tick as a symbol. so there is no 1 hour bars.
                              hope this ramble is a bit more clear.

                              thanks for listening

                              Comment

                              Working...
                              X