Description:
MACD Crossover
Formula Parameters:
Notes:
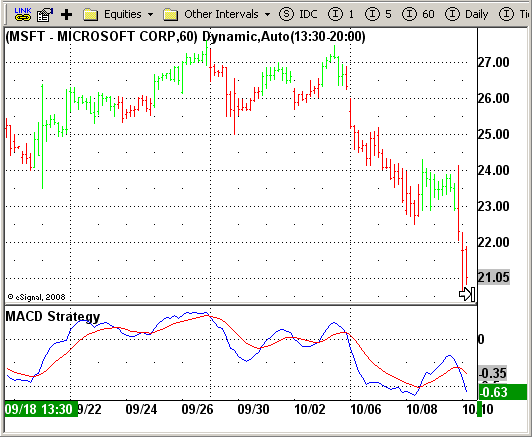
MACD Ö Moving Average Convergence Divergence. The MACD is calculated
by subtracting a 26-day moving average of a security's price from a
12-day moving average of its price. The result is an indicator that
oscillates above and below zero. When the MACD is above zero, it means
the 12-day moving average is higher than the 26-day moving average.
This is bullish as it shows that current expectations (i.e., the 12-day
moving average) are more bullish than previous expectations (i.e., the
26-day average). This implies a bullish, or upward, shift in the supply/demand
lines. When the MACD falls below zero, it means that the 12-day moving average
is less than the 26-day moving average, implying a bearish shift in the
supply/demand lines.
A 9-day moving average of the MACD (not of the security's price) is usually
plotted on top of the MACD indicator. This line is referred to as the "signal"
line. The signal line anticipates the convergence of the two moving averages
(i.e., the movement of the MACD toward the zero line).
Let's consider the rational behind this technique. The MACD is the difference
between two moving averages of price. When the shorter-term moving average rises
above the longer-term moving average (i.e., the MACD rises above zero), it means
that investor expectations are becoming more bullish (i.e., there has been an
upward shift in the supply/demand lines). By plotting a 9-day moving average of
the MACD, we can see the changing of expectations (i.e., the shifting of the
supply/demand lines) as they occur.
Download File:
MACDStrategy.efs
EFS Code:
PHP Code:
/*********************************

Provided By:

    eSignal (Copyright c eSignal), a division of Interactive Data

    Corporation. 2008. All rights reserved. This sample eSignal

    Formula Script (EFS) is for educational purposes only and may be

    modified and saved under a new file name.  eSignal is not responsible

    for the functionality once modified.  eSignal reserves the right

    to modify and overwrite this EFS file with each new release.


Description:

    MACD Crossover


Version:            1.0  10/15/2008


Notes:

    MACD Ö Moving Average Convergence Divergence. The MACD is calculated

    by subtracting a 26-day moving average of a security's price from a

    12-day moving average of its price. The result is an indicator that

    oscillates above and below zero. When the MACD is above zero, it means

    the 12-day moving average is higher than the 26-day moving average.

    This is bullish as it shows that current expectations (i.e., the 12-day

    moving average) are more bullish than previous expectations (i.e., the

    26-day average). This implies a bullish, or upward, shift in the supply/demand

    lines. When the MACD falls below zero, it means that the 12-day moving average

    is less than the 26-day moving average, implying a bearish shift in the

    supply/demand lines.

    A 9-day moving average of the MACD (not of the security's price) is usually

    plotted on top of the MACD indicator. This line is referred to as the "signal"

    line. The signal line anticipates the convergence of the two moving averages

    (i.e., the movement of the MACD toward the zero line).

    Let's consider the rational behind this technique. The MACD is the difference

    between two moving averages of price. When the shorter-term moving average rises

    above the longer-term moving average (i.e., the MACD rises above zero), it means

    that investor expectations are becoming more bullish (i.e., there has been an

    upward shift in the supply/demand lines). By plotting a 9-day moving average of

    the MACD, we can see the changing of expectations (i.e., the shifting of the

    supply/demand lines) as they occur.


Formula Parameters:                     Default:


**********************************/


var bInit = false;


function preMain() {

    setPriceStudy(false);

    setColorPriceBars(true);

    setDefaultPriceBarColor(Color.grey);

    setStudyTitle("MACD Strategy");

    setCursorLabelName("MACD", 0);

    setCursorLabelName("SIGNAL", 1);

    setDefaultBarFgColor(Color.blue, 0);

    setDefaultBarFgColor(Color.red, 1);

}


var xMACD = null;

var xSignal = null;


function main() {


    if (bInit == false) {

        xMACD = macd(8, 16, 11);

        xSignal = macdSignal(8, 16, 11);

        bInit = true;

    }


    if (getCurrentBarCount() < 16) return;

    if (getCurrentBarIndex() == 0) return;


    if(xSignal.getValue(0) < xMACD.getValue(0) && !Strategy.isLong()) {

        Strategy.doLong("Long", Strategy.CLOSE , Strategy.NEXTBAR);

    }


    if(xSignal.getValue(0) > xMACD.getValue(0) && !Strategy.isShort()) {

        Strategy.doShort("Short", Strategy.CLOSE , Strategy.NEXTBAR);

    }


    if(Strategy.isLong())

        setPriceBarColor(Color.lime);

    else if(Strategy.isShort())

        setPriceBarColor(Color.red);


    return new Array(xMACD.getValue(0), xSignal.getValue(0));

}