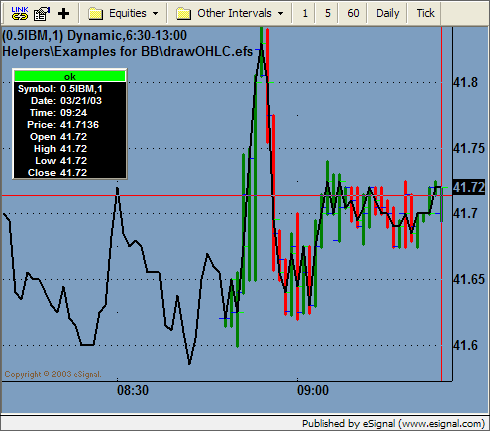
File Name: drawOHLC.efs
Description:
Use graphics commands to draw OHLC information for a spread.
Formula Parameters:
nBarThickness: Default is 3
nNumBars: Default is 60
Notes:
This formula will not draw OHLC info for historical bars. The information is only drawn on the current bar as new bars come in during real time and will store up to 60 bars of information going forward.
Download File:
drawOHLC.efs

EFS Code:
Description:
Use graphics commands to draw OHLC information for a spread.
Formula Parameters:
nBarThickness: Default is 3
nNumBars: Default is 60
Notes:
This formula will not draw OHLC info for historical bars. The information is only drawn on the current bar as new bars come in during real time and will store up to 60 bars of information going forward.
Download File:
drawOHLC.efs

EFS Code:
PHP Code:
/*********************************

Provided By : eSignal. (c) Copyright 2003

*********************************/

function preMain() {

    setPriceStudy(true);

    setShowCursorLabel(false);

}


var colorBG = null;

var colorOpen = null;

var colorClose = null;

var vOpen;

var vHigh;

var vLow;

var vClose;

var DrawCntr = 0;

var vLoading = true;


function main(nBarThickness, nNumBars) {

    if (nBarThickness == null) {

        nBarThickness = 3;

    }

    if (nNumBars == null || Math.abs(nNumBars) > 60) {

        nNumBars = 60;

    }


    var nBarState = getBarState();


    if (getCurrentBarIndex() == 0) {

        vLoading = false;

    }


    var vPrice = close();

    if (nBarState == BARSTATE_NEWBAR) {

        if (vLoading == false) {

            colorBG = null;

            colorOpen = null;

            colorClose = null;

            vOpen = vPrice;

            vHigh = vPrice;

            vLow = vPrice;

            vClose = vPrice;

        }

        DrawCntr += 1;

        if (DrawCntr > nNumBars) {

            DrawCntr = 0;

        }

    }


    if (vLoading == false) {

        vHigh = Math.max(vPrice, vHigh);

        vLow = Math.min(vPrice, vLow);

        vClose = vPrice;

        //open

        if (nBarState == BARSTATE_NEWBAR) {

            drawLineRelative(-1, vOpen, 0, vOpen, PS_SOLID, 1, Color.blue, "Open" + DrawCntr);

        }

        //high - low

        if (vClose >= vOpen) {

            colorHL = Color.green;

        } else {

            colorHL = Color.red;

        }

        drawLineRelative(0, vHigh, 0, vLow, PS_SOLID, nBarThickness, colorHL, "HL" + DrawCntr);

        //close

        drawLineRelative(0, vClose, 1, vClose, PS_SOLID, 1, Color.lime, "Close" + DrawCntr);

    }


    return;

}