 Tweet
Tweet
File Name: DTI.efs
Description:
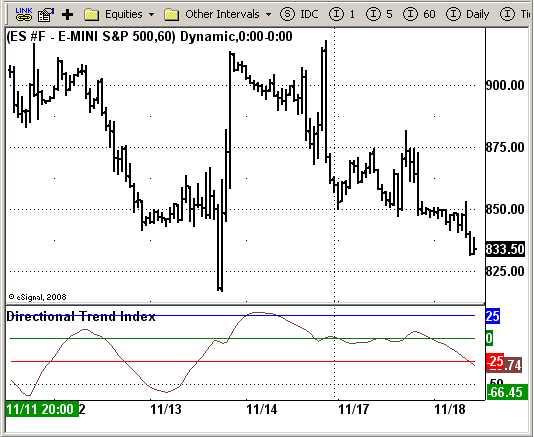
Directional Trend Index (DTI)
Formula Parameters:
r: 14
s: 10
u: 5
OB: 25
OS: -25
Notes:
This technique was described by William Blau in his book "Momentum,
Direction and Divergence" (1995). His book focuses on three key aspects
of trading: momentum, direction and divergence. Blau, who was an electrical
engineer before becoming a trader, thoroughly examines the relationship between
price and momentum in step-by-step examples. From this grounding, he then looks
at the deficiencies in other oscillators and introduces some innovative techniques,
including a fresh twist on Stochastics. On directional issues, he analyzes the
intricacies of ADX and offers a unique approach to help define trending and
non-trending periods.
Directional Trend Index is an indicator similar to DM+ developed by Welles Wilder.
The DM+ (a part of Directional Movement System which includes both DM+ and
DM- indicators) indicator helps determine if a security is "trending." William
Blau added to it a zeroline, relative to which the indicator is deemed positive or
negative. A stable uptrend is a period when the DTI value is positive and rising, a
downtrend when it is negative and falling.
Download File:
DTI.efs
EFS Code:
Description:
Directional Trend Index (DTI)
Formula Parameters:
r: 14
s: 10
u: 5
OB: 25
OS: -25
Notes:
This technique was described by William Blau in his book "Momentum,
Direction and Divergence" (1995). His book focuses on three key aspects
of trading: momentum, direction and divergence. Blau, who was an electrical
engineer before becoming a trader, thoroughly examines the relationship between
price and momentum in step-by-step examples. From this grounding, he then looks
at the deficiencies in other oscillators and introduces some innovative techniques,
including a fresh twist on Stochastics. On directional issues, he analyzes the
intricacies of ADX and offers a unique approach to help define trending and
non-trending periods.
Directional Trend Index is an indicator similar to DM+ developed by Welles Wilder.
The DM+ (a part of Directional Movement System which includes both DM+ and
DM- indicators) indicator helps determine if a security is "trending." William
Blau added to it a zeroline, relative to which the indicator is deemed positive or
negative. A stable uptrend is a period when the DTI value is positive and rising, a
downtrend when it is negative and falling.
Download File:
DTI.efs
EFS Code:
PHP Code:
/*********************************

Provided By:

    eSignal (Copyright c eSignal), a division of Interactive Data

    Corporation. 2008. All rights reserved. This sample eSignal

    Formula Script (EFS) is for educational purposes only and may be

    modified and saved under a new file name.  eSignal is not responsible

    for the functionality once modified.  eSignal reserves the right

    to modify and overwrite this EFS file with each new release.


Description:

    Directional Trend Index (DTI)


Version:            1.0  09/26/2008


Formula Parameters:                     Default:

    r                                    14

    s                                    10

    u                                    5

    OB                                   25

    OS                                   -25


Notes:

    This technique was described by William Blau in his book "Momentum,

    Direction and Divergence" (1995). His book focuses on three key aspects

    of trading: momentum, direction and divergence. Blau, who was an electrical

    engineer before becoming a trader, thoroughly examines the relationship between

    price and momentum in step-by-step examples. From this grounding, he then looks

    at the deficiencies in other oscillators and introduces some innovative techniques,

    including a fresh twist on Stochastics. On directional issues, he analyzes the

    intricacies of ADX and offers a unique approach to help define trending and

    non-trending periods.

    Directional Trend Index is an indicator similar to DM+ developed by Welles Wilder.

    The DM+ (a part of Directional Movement System which includes both DM+ and

    DM- indicators) indicator helps determine if a security is "trending." William

    Blau added to it a zeroline, relative to which the indicator is deemed positive or

    negative. A stable uptrend is a period when the DTI value is positive and rising, a

    downtrend when it is negative and falling.


**********************************/


var fpArray = new Array();

var bInit = false;


function preMain() {

    setPriceStudy(false);

    setStudyTitle("Directional Trend Index");

    setCursorLabelName("DTI", 0);

    setCursorLabelName("OB", 1);

    setCursorLabelName("OS", 2);

    setCursorLabelName("ZeroLine", 3);

    setDefaultBarFgColor(Color.brown, 0);

    setDefaultBarFgColor(Color.blue, 1);

    setDefaultBarFgColor(Color.red, 2);

    setDefaultBarFgColor(Color.green, 3);


    var x=0;

    fpArray[x] = new FunctionParameter("r", FunctionParameter.NUMBER);

    with(fpArray[x++]){

        setLowerLimit(1);

        setDefault(14);

    }


    fpArray[x] = new FunctionParameter("s", FunctionParameter.NUMBER);

    with(fpArray[x++]){

        setLowerLimit(1);

        setDefault(10);

    }


    fpArray[x] = new FunctionParameter("u", FunctionParameter.NUMBER);

    with(fpArray[x++]){

        setLowerLimit(1);

        setDefault(5);

    }


    fpArray[x] = new FunctionParameter("OB", FunctionParameter.NUMBER);

    with(fpArray[x++]){

        setDefault(25);

    }


    fpArray[x] = new FunctionParameter("OS", FunctionParameter.NUMBER);

    with(fpArray[x++]){

        setDefault(-25);

    }

}


var xHMU = null;

var xLMD = null;

var xPrice = null;

var xPriceAbs = null;

var xuXA = null;

var xuXAAbs = null;


function main(r, s, u, OB, OS) {


    if ( bInit == false ) {

        xHMU = efsInternal("Calc_HMU");

        xLMD = efsInternal("Calc_LMD");

        xPrice = efsInternal("Calc_Price", xHMU, xLMD);

        xPriceAbs = efsInternal("Calc_PriceAbs", xPrice);

        xuXA = ema(u, ema(s, ema(r, xPrice)));

        xuXAAbs = ema(u, ema(s, ema(r, xPriceAbs)));

        bInit = true;

    }


    if (getCurrentBarCount() < Math.max(Math.max(r, s), u)) return;


    var Val1 = 100 * xuXA.getValue(0);

    var Val2 = xuXAAbs.getValue(0);

    var DTI = 0;

    if (Val2 != 0) DTI = Val1 / Val2;

    else DTI = 0;

    return new Array(DTI, OB, OS, 0);

}


function Calc_PriceAbs(xPrice) {

var nRes = 0;

    nRes = Math.abs(xPrice.getValue(0));

    if (nRes == null) nRes = 1;

    return nRes;

}


function Calc_Price(xHMU, xLMD) {

var nRes = 0;

    nRes = xHMU.getValue(0) - xLMD.getValue(0);

    if (nRes == null) nRes = 1;

    return nRes;

}


function Calc_HMU() {

var nRes = 0;

    if ((high(0) - high(-1)) > 0)

    {

        nRes = high(0) - high(-1);

    }

    else nRes = 0;

    if (nRes == null) nRes = 1;

    return nRes;

}


function Calc_LMD() {

var nRes = 0;

    if ((low(0) - low(-1)) < 0)

    {

        nRes = -(low(0) - low(-1));

    }

    else nRes = 0;

    return nRes;

}