 Tweet
Tweet
File Name: HistVolatility.efs
Description:
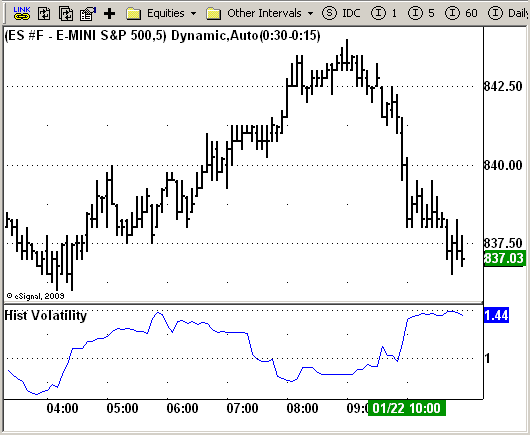
Historical Volatility
Formula Parameters:
LookBack : 20
Annual : 365
Notes:
Markets oscillate from periods of low volatility to high volatility
and back. The author`s research indicates that after periods of
extremely low volatility, volatility tends to increase and price
may move sharply. This increase in volatility tends to correlate
with the beginning of short- to intermediate-term moves in price.
They have found that we can identify which markets are about to make
such a move by measuring the historical volatility and the application
of pattern recognition.
The indicator is calculating as the standard deviation of day-to-day
logarithmic closing price changes expressed as an annualized percentage.
Download File:
HistVolatility.efs
EFS Code:
Description:
Historical Volatility
Formula Parameters:
LookBack : 20
Annual : 365
Notes:
Markets oscillate from periods of low volatility to high volatility
and back. The author`s research indicates that after periods of
extremely low volatility, volatility tends to increase and price
may move sharply. This increase in volatility tends to correlate
with the beginning of short- to intermediate-term moves in price.
They have found that we can identify which markets are about to make
such a move by measuring the historical volatility and the application
of pattern recognition.
The indicator is calculating as the standard deviation of day-to-day
logarithmic closing price changes expressed as an annualized percentage.
Download File:
HistVolatility.efs
EFS Code:
PHP Code:
/*********************************

Provided By:

    eSignal (Copyright c eSignal), a division of Interactive Data

    Corporation. 2008. All rights reserved. This sample eSignal

    Formula Script (EFS) is for educational purposes only and may be

    modified and saved under a new file name.  eSignal is not responsible

    for the functionality once modified.  eSignal reserves the right

    to modify and overwrite this EFS file with each new release.


Description:

    Hist Volatility


Version:            1.0  01/19/2009


Formula Parameters:                     Default:

    LookBack                            20

    Annual                              365


Notes:

    Markets oscillate from periods of low volatility to high volatility

    and back. The author`s research indicates that after periods of

    extremely low volatility, volatility tends to increase and price

    may move sharply. This increase in volatility tends to correlate

    with the beginning of short- to intermediate-term moves in price.

    They have found that we can identify which markets are about to make

    such a move by measuring the historical volatility and the application

    of pattern recognition.

    The indicator is calculating as the standard deviation of day-to-day

    logarithmic closing price changes expressed as an annualized percentage.


**********************************/


var fpArray = new Array();

var bInit = false;


function preMain() {

    setPriceStudy(false);

    setStudyTitle("Hist Volatility");

    setCursorLabelName("HisVol");


    var x=0;

    fpArray[x] = new FunctionParameter("LookBack", FunctionParameter.NUMBER);

    with(fpArray[x++]){

        setLowerLimit(1);

        setDefault(20);

    }


    fpArray[x] = new FunctionParameter("Annual", FunctionParameter.NUMBER);

    with(fpArray[x++]){

        setLowerLimit(1);

        setDefault(365);

    }

}


var xPrice1 = null;

var xPrice1Avg = null;

var xStdDev = null;


function main(LookBack, Annual) {

var nState = getBarState();

var nPer = 0;


    if(isIntraday() || isDaily()) nPer = 1;

    if (nPer == 0) nPer = 7;


    if (nState == BARSTATE_ALLBARS) {

        if (LookBack == null) LookBack = 20;

        if (Annual == null) Annual = 365;

    }


    if ( bInit == false ) {

        xPrice1 = efsInternal("Calc_Price1");

        xPrice1Avg = sma(LookBack, xPrice1);

        xStdDev = efsInternal("Calc_StdDev", LookBack, xPrice1Avg, xPrice1);

        bInit = true;

    }


    if (getCurrentBarCount() < LookBack + 1) return;


    var nAvg = xPrice1Avg.getValue(0);

    var HVol = (xStdDev.getValue(0) * Math.sqrt(Annual / nPer)) * 100;

    return HVol;

}


function Calc_Price1() {

var nRes = 0;

    if (close(-1) == null) return;

    nRes = Math.log(close(0) / close(-1));

    if (nRes == null) nRes = 1;

    return nRes;

}


function Calc_StdDev(LookBack, xPrice1Avg, xPrice1) {

var nRes = 0;

    if (xPrice1Avg.getValue(0) == null) return;

    for (var i = 0; i < LookBack; i++) {

        nRes += (xPrice1.getValue(-i) - xPrice1Avg.getValue(0)) * (xPrice1.getValue(-i) - xPrice1Avg.getValue(0));

    }

    nRes = Math.sqrt(nRes / LookBack);

    if (nRes == null) nRes = 1;

    return nRes;

}