 Tweet
Tweet
File Name: SEB_LinRegSlope.efs
Description:
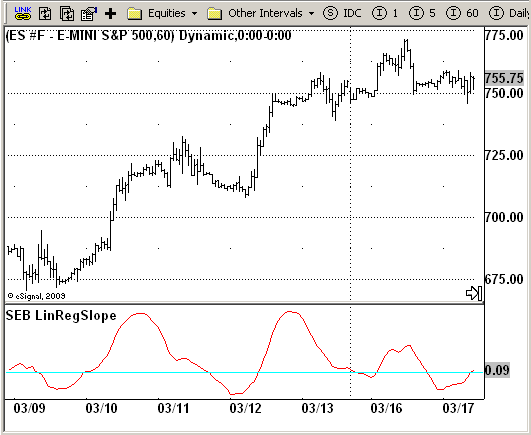
This indicator plots the slope of linear regression in osccilator-like
manner. This is a part of Standard Error Bands study.
Formula Parameters:
Length : 21
Notes:
Linear Regression is a concept also know as the "least squares method" or
"best fit". Linear Regression attempts to fit a straight line between several
data points in such a way that distance between each data point and the line is
minimized.
"Standard Error Bands" Jon Anderson, Stocks&Commodities Magazine, Traders Tips, 09/1996
Download File:
SEB_LinRegSlope.efs
EFS Code:
Description:
This indicator plots the slope of linear regression in osccilator-like
manner. This is a part of Standard Error Bands study.
Formula Parameters:
Length : 21
Notes:
Linear Regression is a concept also know as the "least squares method" or
"best fit". Linear Regression attempts to fit a straight line between several
data points in such a way that distance between each data point and the line is
minimized.
"Standard Error Bands" Jon Anderson, Stocks&Commodities Magazine, Traders Tips, 09/1996
Download File:
SEB_LinRegSlope.efs
EFS Code:
PHP Code:
/*********************************

Provided By:

    eSignal (Copyright c eSignal), a division of Interactive Data

    Corporation. 2009. All rights reserved. This sample eSignal

    Formula Script (EFS) is for educational purposes only and may be

    modified and saved under a new file name.  eSignal is not responsible

    for the functionality once modified.  eSignal reserves the right

    to modify and overwrite this EFS file with each new release.


Description:

    This indicator plots the slope of linear regression in osccilator-like

    manner. This is a part of Standard Error Bands study.


Version:            1.0  03/19/2009


Formula Parameters:                     Default:

    Length                              21


Notes:

    Linear Regression is a concept also know as the "least squares method" or

    "best fit". Linear Regression attempts to fit a straight line between several

    data points in such a way that distance between each data point and the line is

    minimized.

    "Standard Error Bands" Jon Anderson, Stocks&Commodities Magazine, Traders Tips, 09/1996

**********************************/


var fpArray = new Array();

var bInit = false;


function preMain() {

    setStudyTitle("SEB LinRegSlope");

    setCursorLabelName("Slope", 0);

    setDefaultBarFgColor(Color.red, 0);

    addBand(0, PS_SOLID, 1, Color.cyan);


    var x=0;

    fpArray[x] = new FunctionParameter("Length", FunctionParameter.NUMBER);

    with(fpArray[x++]){

        setLowerLimit(1);

        setDefault(21);

    }

}


var xSL = null;


function main(Length) {

var nBarState = getBarState();

var nSL = 0;

    if (nBarState == BARSTATE_ALLBARS) {

        if (Length == null) Length = 21;

    }

    if (bInit == false) {

        xSL = efsInternal("calc", Length);

        bInit = true;

    }

    nSL = xSL.getValue(0);

    if (nSL == null) return;

    return nSL;

}


var xClose = null;

var xInit = false;


function calc(Length) {

var SL = 0;

var SumBars = Length * (Length - 1) * 0.5;

var SumSqrBars = (Length - 1) * Length * (2 * Length - 1) / 6;

var Sum1 = 0;

var SumY = 0;

var i = 0;


    if(xInit==false){

        xClose = close();

        xInit = true;

    }

    for (i = 0; i < Length; i++) {

        Sum1 += i * xClose.getValue(-i);

        SumY += xClose.getValue(-i);

    }

    var Sum2 = SumBars * SumY;

    var Num1 = Length * Sum1 - Sum2;

    var Num2 = SumBars * SumBars - Length * SumSqrBars;

    SL = Num1 / Num2;

    return SL;

}