 Tweet
Tweet
File Name: Z_Score.efs
Description:
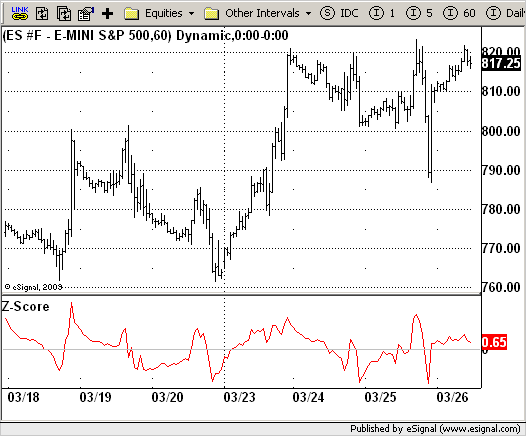
Z-Score
Formula Parameters:
Period : 20
Notes:
The author of this indicator is Veronique Valcu. The z-score (z) for a data
item x measures the distance (in standard deviations StdDev) and direction
of the item from its mean (U):
z = (x-StdDev) / U
A value of zero indicates that the data item x is equal to the mean U, while
positive or negative values show that the data item is above (x>U) or below
(x Values of +2 and -2 show that the data item is two standard deviations
above or below the chosen mean, respectively, and over 95.5% of all data
items are contained within these two horizontal references (see Figure 1).
We substitute x with the closing price C, the mean U with simple moving
average (SMA) of n periods (n), and StdDev with the standard deviation of
closing prices for n periods, the above formula becomes:
Z_score = (C - SMA(n)) / StdDev(C,n)
The z-score indicator is not new, but its use can be seen as a supplement to
Bollinger bands. It offers a simple way to assess the position of the price
vis-a-vis its resistance and support levels expressed by the Bollinger Bands.
In addition, crossings of z-score averages may signal the start or the end of
a tradable trend. Traders may take a step further and look for stronger signals
by identifying common crossing points of z-score, its average, and average of average.
Download File:
Z_Score.efs
EFS Code:
Description:
Z-Score
Formula Parameters:
Period : 20
Notes:
The author of this indicator is Veronique Valcu. The z-score (z) for a data
item x measures the distance (in standard deviations StdDev) and direction
of the item from its mean (U):
z = (x-StdDev) / U
A value of zero indicates that the data item x is equal to the mean U, while
positive or negative values show that the data item is above (x>U) or below
(x Values of +2 and -2 show that the data item is two standard deviations
above or below the chosen mean, respectively, and over 95.5% of all data
items are contained within these two horizontal references (see Figure 1).
We substitute x with the closing price C, the mean U with simple moving
average (SMA) of n periods (n), and StdDev with the standard deviation of
closing prices for n periods, the above formula becomes:
Z_score = (C - SMA(n)) / StdDev(C,n)
The z-score indicator is not new, but its use can be seen as a supplement to
Bollinger bands. It offers a simple way to assess the position of the price
vis-a-vis its resistance and support levels expressed by the Bollinger Bands.
In addition, crossings of z-score averages may signal the start or the end of
a tradable trend. Traders may take a step further and look for stronger signals
by identifying common crossing points of z-score, its average, and average of average.
Download File:
Z_Score.efs
EFS Code:
PHP Code:
/*********************************

Provided By:

    eSignal (Copyright c eSignal), a division of Interactive Data

    Corporation. 2009. All rights reserved. This sample eSignal

    Formula Script (EFS) is for educational purposes only and may be

    modified and saved under a new file name.  eSignal is not responsible

    for the functionality once modified.  eSignal reserves the right

    to modify and overwrite this EFS file with each new release.


Description:

    Z-Score


Version:            1.0  03/24/2009


Formula Parameters:                     Default:

    Period                              20


Notes:

    The author of this indicator is Veronique Valcu. The z-score (z) for a data

    item x measures the distance (in standard deviations StdDev) and direction

    of the item from its mean (U):

        z = (x-StdDev) / U

    A value of zero indicates that the data item x is equal to the mean U, while

    positive or negative values show that the data item is above (x>U) or below

    (x Values of +2 and -2 show that the data item is two standard deviations

    above or below the chosen mean, respectively, and over 95.5% of all data

    items are contained within these two horizontal references (see Figure 1).

    We substitute x with the closing price C, the mean U with simple moving

    average (SMA) of n periods (n), and StdDev with the standard deviation of

    closing prices for n periods, the above formula becomes:

        Z_score = (C - SMA(n)) / StdDev(C,n)

    The z-score indicator is not new, but its use can be seen as a supplement to

    Bollinger bands. It offers a simple way to assess the position of the price

    vis-a-vis its resistance and support levels expressed by the Bollinger Bands.

    In addition, crossings of z-score averages may signal the start or the end of

    a tradable trend. Traders may take a step further and look for stronger signals

    by identifying common crossing points of z-score, its average, and average of average.

**********************************/


var fpArray = new Array();

var bInit = false;


function preMain() {

    setStudyTitle("Z-Score");

    setCursorLabelName("Z-Score", 0);

    setDefaultBarFgColor(Color.red, 0);

    addBand(0, PS_SOLID, 1, Color.lightgrey);


    var x=0;

    fpArray[x] = new FunctionParameter("Period", FunctionParameter.NUMBER);

    with(fpArray[x++]){

        setLowerLimit(1);

        setDefault(20);

    }

}


var xZ_Score = null;


function main(Period) {

var nBarState = getBarState();

var nZ_Score = 0;


    if (nBarState == BARSTATE_ALLBARS) {

        if(Period == null) Period = 20;

    }

    if (bInit == false) {

        xZ_Score = efsInternal("Calc_Z_Score", Period, sma(Period), close());

        bInit = true;

    }


    nZ_Score = xZ_Score.getValue(0);

    if (nZ_Score == null) return;

    return nZ_Score;

}


function Calc_Z_Score(Period, xMA, xClose) {

var nRes = 0;

var StdDev = 0;

var SumSqr = 0;

var counter = 0;

    if(xMA.getValue(0) == null) return;

    for(counter = 0; counter < Period; counter++)

        SumSqr += Math.pow((xClose.getValue(-counter) - xMA.getValue(0)), 2);


    StdDev = Math.sqrt(SumSqr / Period);


    nRes = (xClose.getValue(0) -  xMA.getValue(0)) / StdDev;

    return nRes;

}