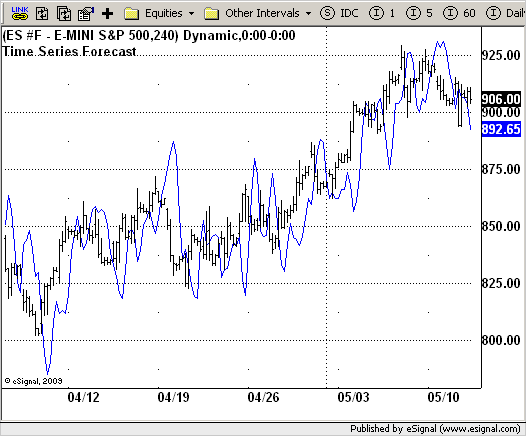
File Name: TimeSeriesForecast.efs
Description:
Time Series Forecast (TSF)
Formula Parameters:
nLength : 5
nBarPlus : 7
Notes:
This technical indicator is based on linear regression analysis.
The value of TSF for each bar is based on a regression analysis
of the preceding N bars. N is called the regression period in
the setup window for TSF. The user specifies a forecast period
F. F is used to derive a predicted (forecasted) price value F
periods in the future based on the slope of the regression line
for the preceding N periods.
Download File:
TimeSeriesForecast.efs

EFS Code:
Description:
Time Series Forecast (TSF)
Formula Parameters:
nLength : 5
nBarPlus : 7
Notes:
This technical indicator is based on linear regression analysis.
The value of TSF for each bar is based on a regression analysis
of the preceding N bars. N is called the regression period in
the setup window for TSF. The user specifies a forecast period
F. F is used to derive a predicted (forecasted) price value F
periods in the future based on the slope of the regression line
for the preceding N periods.
Download File:
TimeSeriesForecast.efs

EFS Code:
PHP Code:
/*********************************

Provided By:

    eSignal (Copyright c eSignal), a division of Interactive Data

    Corporation. 2009. All rights reserved. This sample eSignal

    Formula Script (EFS) is for educational purposes only and may be

    modified and saved under a new file name.  eSignal is not responsible

    for the functionality once modified.  eSignal reserves the right

    to modify and overwrite this EFS file with each new release.


Description:

    Time Series Forecast (TSF)


Version:            1.0  05/12/2009


Formula Parameters:                     Default:

    nLength                             5

    nBarPlus                            7


Notes:

    This technical indicator is based on linear regression analysis.

    The value of TSF for each bar is based on a regression analysis

    of the preceding N bars. N is called the regression period in

    the setup window for TSF. The user specifies a forecast period

    F. F is used to derive a predicted (forecasted) price value F

    periods in the future based on the slope of the regression line

    for the preceding N periods.


**********************************/

var fpArray = new Array();

var bInit = false;


function preMain() {

    setPriceStudy(true);

    setStudyTitle("Time Series Forecast");

    setCursorLabelName("TSF");

    var x = 0;

    fpArray[x] = new FunctionParameter("nLength", FunctionParameter.NUMBER);

    with(fpArray[x++]) {

        setLowerLimit(1);

        setDefault(5);

    }

    fpArray[x] = new FunctionParameter("nBarPlus", FunctionParameter.NUMBER);

    with(fpArray[x++]) {

        setLowerLimit(1);

        setDefault(7);

    }

}


var xTimeSeriesForecast = null;


function main(nLength, nBarPlus) {

var nBarState = getBarState();

var nTimeSeriesForecast = 0;

    if (nBarState == BARSTATE_ALLBARS) {

        if (nLength == null) nLength = nLength;

        if (nBarPlus == null) nLength = nBarPlus;

    }

    if (bInit == false) {

        xTimeSeriesForecast = efsInternal("Calc_TSF", nLength, nBarPlus);

        bInit = true;

    }

    nTimeSeriesForecast = xTimeSeriesForecast.getValue(0);

    if (nTimeSeriesForecast == null) return;

    return nTimeSeriesForecast;

}


var xClose = null;

var bSecondInit = false;


function Calc_TSF(nLength, nBarPlus) {

var SL = 0;

var TSF = 0;

var SumBars = nLength * (nLength - 1) * 0.5;

var SumSqrBars = (nLength - 1) * nLength * (2 * nLength - 1) / 6;

var Sum1 = 0;

var SumY = 0;

var i = 0;

var Slope = 0;

var Intercept = 0;

    if (getCurrentBarCount() <= nLength) return;

    if(bSecondInit == false){

        xClose = close();

        bSecondInit = true;

    }

    for (i = 0; i < nLength; i++) {

        Sum1 += i * xClose.getValue(-i);

        SumY += xClose.getValue(-i);

    }

    var Sum2 = SumBars * SumY;

    var Num1 = nLength * Sum1 - Sum2;

    var Num2 = SumBars * SumBars - nLength * SumSqrBars;

    if (Num2 == 0) return;

    Slope = Num1 / Num2;

    SL = Num1 / Num2;

    Intercept = (SumY - Slope * SumBars) / nLength;

    TSF = Intercept + Slope * (nLength - 1 - nBarPlus);

    return TSF;

}