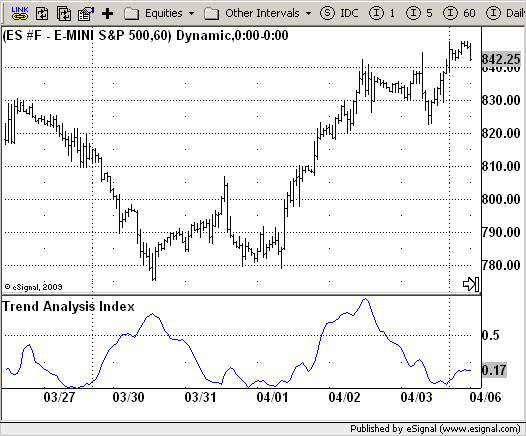
File Name: TAI.efs
Description:
Trend Analysis Index (TAI)
Formula Parameters:
AvgLen : 28
TAILen : 5
Source of TAI : Close
Notes:
In essence, it is simply the standard deviation of the last x bars of a
y-bar moving average. Thus, the TAI is a simple trend indicator when prices
trend with authority, the slope of the moving average increases, and when
prices meander in a trendless range, the slope of the moving average decreases.
Download File:
TAI.efs

EFS Code:
Description:
Trend Analysis Index (TAI)
Formula Parameters:
AvgLen : 28
TAILen : 5
Source of TAI : Close
Notes:
In essence, it is simply the standard deviation of the last x bars of a
y-bar moving average. Thus, the TAI is a simple trend indicator when prices
trend with authority, the slope of the moving average increases, and when
prices meander in a trendless range, the slope of the moving average decreases.
Download File:
TAI.efs

EFS Code:
PHP Code:
/*********************************

Provided By:

    eSignal (Copyright c eSignal), a division of Interactive Data

    Corporation. 2009. All rights reserved. This sample eSignal

    Formula Script (EFS) is for educational purposes only and may be

    modified and saved under a new file name.  eSignal is not responsible

    for the functionality once modified.  eSignal reserves the right

    to modify and overwrite this EFS file with each new release.


Description:

    Trend Analysis Index


Version:            1.0  05/20/2009


Formula Parameters:                     Default:

    AvgLen                              28

    TAILen                              5

    Source of TAI                       Close


Notes:

    In essence, it is simply the standard deviation of the last x bars of a

    y-bar moving average. Thus, the TAI is a simple trend indicator when prices

    trend with authority, the slope of the moving average increases, and when

    prices meander in a trendless range, the slope of the moving average decreases.

**********************************/

var fpArray = new Array();

var bInit = false;


function preMain() {

    setPriceStudy(false);

    setStudyTitle("Trend Analysis Index");

    setCursorLabelName("TAI");

    var x = 0;

    fpArray[x] = new FunctionParameter("AvgLen", FunctionParameter.NUMBER);

    with(fpArray[x++]) {

        setLowerLimit(1);

        setDefault(28);

    }

    fpArray[x] = new FunctionParameter("TAILen", FunctionParameter.NUMBER);

    with(fpArray[x++]) {

        setLowerLimit(1);

        setDefault(5);

    }

    fpArray[x] = new FunctionParameter("sPrice", FunctionParameter.STRING);

    with(fpArray[x++]){

        setName("Source of TAI");

        addOption("open");

        addOption("high");

        addOption("low");

        addOption("close");

        addOption("hl2");

        addOption("hlc3");

        addOption("ohlc4");

        setDefault("close");

    }

}


var xTAI = null;


function main(sPrice, AvgLen, TAILen) {

var nBarState = getBarState();

var nTAI = 0;

    if (nBarState == BARSTATE_ALLBARS) {

        if (sPrice == null) sPrice = "close";

        if (AvgLen == null) AvgLen = 28;

        if (TAILen == null) TAILen = 5;

    }

    if (bInit == false) {

        xTAI = efsInternal("Calc_TAI", sPrice, AvgLen, TAILen);

        bInit = true;

    }

    nTAI = xTAI.getValue(0);

    if (nTAI == null) return;

    return nTAI;

}


var bSecondInit = false;

var xSMA = null;

var xHH = null;

var xLL = null;

var xPrice = null;


function Calc_TAI(sPrice, AvgLen, TAILen) {

var nRes = 0;

    if (bSecondInit == false) {

        xPrice = eval(sPrice)();

        xSMA = sma(AvgLen, xPrice);

        xHH = upperDonchian(TAILen, xSMA);

        xLL = lowerDonchian(TAILen, xSMA);

        bSecondInit = true;

    }

    if (xHH.getValue(0) == null) return;

    nRes = (xHH.getValue(0) - xLL.getValue(0)) * 100 / xPrice.getValue(0);

    return nRes;

}