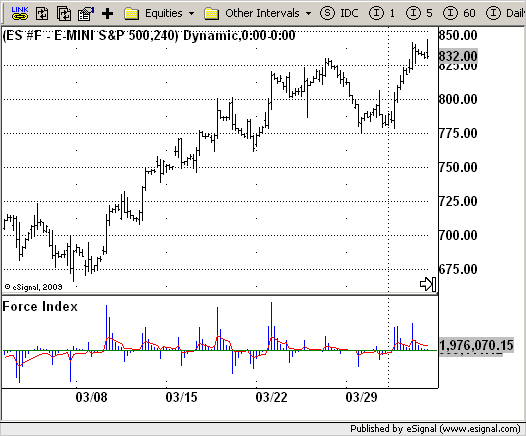
File Name: ForceIndex.efs
Description:
Force Index
Formula Parameters:
XLen1 : 3
XLen3 : 13
Notes:
This Indicator plots the Force Index as described by Dr. Alexander
Elder in "Trading For a Living." The ForceIndex indicator relates
price to volume by multiplying net change and volume. ForceIndex is
calculated using the following equation:
ForceIndex = Volume(today) * (Close(this period) - Close(last period))
ForceIndex is typically presented as two smoothed averages (slow and fast)
to avoid false signals.
Download File:
ForceIndex.efs

EFS Code:
Description:
Force Index
Formula Parameters:
XLen1 : 3
XLen3 : 13
Notes:
This Indicator plots the Force Index as described by Dr. Alexander
Elder in "Trading For a Living." The ForceIndex indicator relates
price to volume by multiplying net change and volume. ForceIndex is
calculated using the following equation:
ForceIndex = Volume(today) * (Close(this period) - Close(last period))
ForceIndex is typically presented as two smoothed averages (slow and fast)
to avoid false signals.
Download File:
ForceIndex.efs

EFS Code:
PHP Code:
/*********************************

Provided By:

    eSignal (Copyright c eSignal), a division of Interactive Data

    Corporation. 2009. All rights reserved. This sample eSignal

    Formula Script (EFS) is for educational purposes only and may be

    modified and saved under a new file name.  eSignal is not responsible

    for the functionality once modified.  eSignal reserves the right

    to modify and overwrite this EFS file with each new release.


Description:

    Force Index


Version:            1.0  04/15/2009


Formula Parameters:                     Default:

    XLen1                               3

    XLen3                               13

Notes:

    This Indicator plots the Force Index as described by Dr. Alexander

    Elder in "Trading For a Living." The ForceIndex indicator relates

    price to volume by multiplying net change and volume. ForceIndex is

    calculated using the following equation:

    ForceIndex = Volume(today) * (Close(this period) - Close(last period))

    ForceIndex is typically presented as two smoothed averages (slow and fast)

    to avoid false signals.

**********************************/

var fpArray = new Array();

var bInit = false;


function preMain() {

    setStudyTitle("Force Index");

    setCursorLabelName("FastAvg", 0);

    setCursorLabelName("SlowAvg", 1);

    setDefaultBarFgColor(Color.blue, 0);

    setDefaultBarFgColor(Color.red, 1);

    setPlotType(PLOTTYPE_HISTOGRAM, 0);

    var x = 0;

    fpArray[x] = new FunctionParameter("XLen1", FunctionParameter.NUMBER);

    with(fpArray[x++]) {

        setLowerLimit(1);

        setDefault(3);

    }

    fpArray[x] = new FunctionParameter("XLen2", FunctionParameter.NUMBER);

    with(fpArray[x++]) {

        setLowerLimit(1);

        setDefault(13);

    }

}


var xForce1 = null;

var xForce2 = null;


function main(XLen1, XLen2) {

var nBarState = getBarState();

var nForce1 = 0;

var nForce2 = 0;

    if (nBarState == BARSTATE_ALLBARS) {

        if (XLen1 == null) XLen1 = 3;

        if (XLen2 == null) XLen2 = 13;

    }


    if (bInit == false) {

        addBand(0, PS_SOLID, 1, Color.green, 1);

        xForce1 = efsInternal("Calc_Force_Index", XLen1, XLen2);

        xForce2 = getSeries(xForce1, 1);

        bInit = true;

    }

    nForce1 = xForce1.getValue(0);

    nForce2 = xForce2.getValue(0);


    return new Array(nForce1, nForce2);

}


var xValue = null;

var xSMA1 = null;

var xSMA2 = null;

var bSecondInit = false;


function Calc_Force_Index(nLen1, nLen2) {

var nRes = 0;

var nSMA1 = 0;

var nSMA2 = 0;

    if (bSecondInit == false) {

        xValue = efsInternal("Calc_Value");

        xSMA1 = ema(nLen1, xValue);

        xSMA2 = ema(nLen2, xValue);

        bSecondInit = true;

    }

    nSMA1 = xSMA1.getValue(0);

    nSMA2 = xSMA2.getValue(0);

    if (nSMA1 == null || nSMA2 == null) return;

    return new Array(nSMA1, nSMA2);

}


function Calc_Value() {

var nRes = 0;

    nRes = volume(0) * (close(0) - close(-1));

    if (nRes == null) return;

    return nRes;

}