File Name: AutoTrendLines.efs
Description:
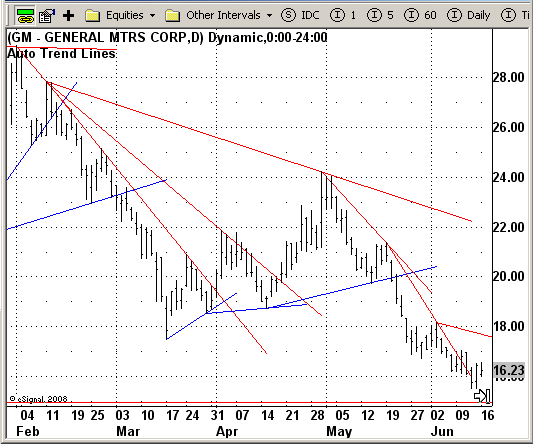
The Trend lines Automatic indicator plots trend lines at significant high
and low points on a chart, helping to determine market direction, breakouts,
and market reversals.
Formula Parameters:
High Swing Strength: 4
Low Swing Strength: 4
Length of Rays: 0
Number Trendlines displayed: 100
Lookback period (# bars): 100
Thickness Resistance lines: 1
Thickness Support lines: 1
Color Resistance lines: Red
Color Support lines: Blue
Display Title Parameters: False
Notes:
Download File:
AutoTrendLines.efs

EFS Code:
Description:
The Trend lines Automatic indicator plots trend lines at significant high
and low points on a chart, helping to determine market direction, breakouts,
and market reversals.
Formula Parameters:
High Swing Strength: 4
Low Swing Strength: 4
Length of Rays: 0
Number Trendlines displayed: 100
Lookback period (# bars): 100
Thickness Resistance lines: 1
Thickness Support lines: 1
Color Resistance lines: Red
Color Support lines: Blue
Display Title Parameters: False
Notes:
Download File:
AutoTrendLines.efs

EFS Code:
PHP Code:
/*********************************

Provided By:

    eSignal (Copyright c eSignal), a division of Interactive Data

    Corporation. 2008. All rights reserved. This sample eSignal

    Formula Script (EFS) is for educational purposes only and may be

    modified and saved under a new file name.  eSignal is not responsible

    for the functionality once modified.  eSignal reserves the right

    to modify and overwrite this EFS file with each new release.


Description:

    The Trendlines Automatic indicator plots trendlines at significant high

    and low points on a chart, helping to determine market direction, breakouts,

    and market reversals.


Version:            1.0  08/08/2008


Notes:


* - -


Formula Parameters:                          Default:

    * High Swing Strength                       4

    * Low Swing Strength                        4

    * Length of Rays                            0

    * Number Trendlines displayed               100

    * Lookback period (# bars)                  100

    * Thickness Resistance lines                1

    * Thickness Support lines                   1

    * Color Resistance lines                    Red

    * Color Support lines                       Blue

    * Display Title Parameters                  False

**********************************/


var fpArray = new Array();

var LineIndexS = 0;

var LineIndexR = 0;


function preMain() {

    setPriceStudy(true);

    setStudyTitle("Auto Trend Lines");

    setShowCursorLabel(false);


    askForInput();

    var x=0;

    fpArray[x] = new FunctionParameter("SwHiStrength", FunctionParameter.NUMBER);

    with(fpArray[x++]){

        setName("High Swing Strength");

        setLowerLimit(1);

        setDefault(4);

    }


    fpArray[x] = new FunctionParameter("SwLoStrength", FunctionParameter.NUMBER);

    with(fpArray[x++]){

        setName("Low Swing Strength");

        setLowerLimit(1);

        setDefault(4);

    }


    fpArray[x] = new FunctionParameter("LengthRaysLine", FunctionParameter.NUMBER);

    with(fpArray[x++]){

        setName("Length of Rays");

        setLowerLimit(0);

        setDefault(0);

    }


    fpArray[x] = new FunctionParameter("NumberTrendLine", FunctionParameter.NUMBER);

    with(fpArray[x++]){

        setName("Number Trendlines displayed");

        setLowerLimit(1);

        setDefault(100);

    }


    fpArray[x] = new FunctionParameter("BackHistoryViewBars", FunctionParameter.NUMBER);

    with(fpArray[x++]){

        setName("Lookback period (# bars)");

        setLowerLimit(1);

        setDefault(100);

    }


    fpArray[x] = new FunctionParameter("ResistanceThickness", FunctionParameter.NUMBER);

    with(fpArray[x++]){

        setName("Thickness Resistance lines");

        setLowerLimit(1);

        setDefault(1);

    }


    fpArray[x] = new FunctionParameter("SupportThickness", FunctionParameter.NUMBER);

    with(fpArray[x++]){

        setName("Thickness Support lines");

        setLowerLimit(1);

        setDefault(1);

    }


    fpArray[x] = new FunctionParameter("ResistanceColor", FunctionParameter.COLOR);

    with(fpArray[x++]){

        setName("Color Resistance lines");

        setDefault(Color.red);

    }


    fpArray[x] = new FunctionParameter("SupportColor", FunctionParameter.COLOR);

    with(fpArray[x++]){

        setName("Color Support lines");

        setDefault(Color.blue);

    }


    fpArray[x] = new FunctionParameter("Parameters", FunctionParameter.BOOLEAN);

    with(fpArray[x++]){

        setName("Display Title Parameters");

        setDefault(false);

    }


}


function main(SwHiStrength, SwLoStrength, ResistanceThickness, ResistanceColor, SupportThickness,

              SupportColor, LengthRaysLine, NumberTrendLine, BackHistoryViewBars, Parameters) {


var nVal;

var nIndex = 0;

var IndexOld = 0;

var X, X1, X2, Y1, Y2, K;

var nBarState = getBarState();


    if(nBarState==BARSTATE_ALLBARS){

        setShowTitleParameters(Parameters);

    }


    if (LineIndexS > NumberTrendLine) {LineIndexS = 1;}

    if (LineIndexR > NumberTrendLine) {LineIndexR = 1;}


    if(nBarState==BARSTATE_NEWBAR) {

        LineIndexS++;

        LineIndexR++;

    }


    nIndex = (SwHiStrength + 1);

    nVal = CreateResistance(nIndex, SwHiStrength);


    if(nVal == true){

        IndexOld = getOldHiPoint(nIndex, SwHiStrength, BackHistoryViewBars);

        if (IndexOld != null) {

            X1 = -IndexOld;

            X2 = -nIndex;

            Y1 = high(X1);

            Y2 = high(X2);

            K = (Y2-Y1) / (X2-X1);

            X2 = X2 - Math.round(X1 / 2)  + LengthRaysLine;

            Y2 = Y1 + K * (X2-X1);

            drawLineRelative( X1, Y1, X2, Y2 , PS_SOLID, ResistanceThickness, ResistanceColor, "Res"+LineIndexR );

        }

    }


    nVal = CreateSupport(nIndex, SwHiStrength, NumberTrendLine);


    if(nVal == true){

        IndexOld = getOldLoPoint(nIndex, SwHiStrength, BackHistoryViewBars);

        if (IndexOld != null) {

            X1 = -IndexOld;

            X2 = -nIndex;

            Y1 = low(X1);

            Y2 = low(X2);

            K = (Y2-Y1) / (X2-X1);

            X2 = X2 - Math.round(X1 / 2) + LengthRaysLine;

            Y2 = Y1 + K * (X2-X1);

            drawLineRelative(X1, Y1, X2, Y2, PS_SOLID, SupportThickness, SupportColor, "Sup"+LineIndexS );

        }

    }


    return null;

}


function CreateResistance(Index, SwHiStrength) {

var Price = high(-Index);

var ResistanceOK = true;

var tmp;


    for(var i =(Index + SwHiStrength); i>Index; i--){

        tmp = i-SwHiStrength-1;

        if(Price < high(-i)) { ResistanceOK = false; }

        if(Price < high(-tmp)) {ResistanceOK = false; }

    }


    if (ResistanceOK == true) {

        return true;

    } else {

        return false;

    }

}


function CreateSupport(Index, SwHiStrength) {

var Price = low(-Index);

var ResistanceOK = true;

var tmp;


    for(var i =(Index + SwHiStrength); i>Index; i--){

        tmp = i-SwHiStrength-1;

        if(Price > low(-i)) { ResistanceOK = false; }

        if(Price >= low(-tmp)) {ResistanceOK = false; }

    }


    if (ResistanceOK == true) {

        return true;

    } else {

        return false;

    }

}


function getOldHiPoint(Index, SwHiStrength, BackHistoryViewBars){

var i = Index + 1;

var Work = true;

var PriceBarNow = high(-Index);


    while(Work == true) {

        if (CreateResistance(i,  SwHiStrength) == true) {

            if(high(-i) > PriceBarNow) { Work = false; }

        }

        i++;

        if (i > BackHistoryViewBars) return;

    }


    return i - 1;

}


function getOldLoPoint(Index, SwHiStrength, BackHistoryViewBars){

var i = Index + 1;

var Work = true;

var PriceBarNow = low(-Index);


    while(Work == true) {

        if (CreateSupport(i, SwHiStrength) == true) {

            if(low(-i) < PriceBarNow) { Work = false; }

        }

        i++;

        if (i > BackHistoryViewBars) return;

    }


    return i - 1;

}