 Tweet
Tweet
File Name: BullBearBalance.efs
Description:
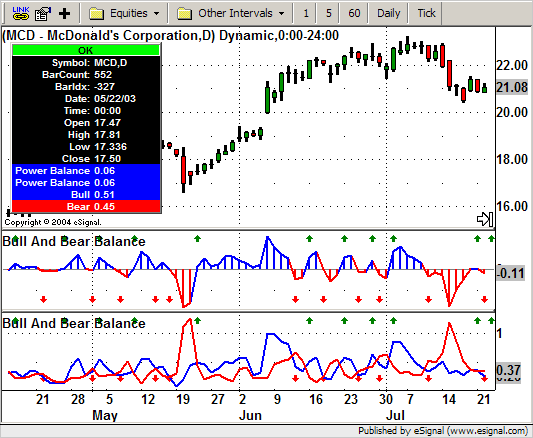
This indicator is based on Bull And Bear Balance Indicator by Vadim Gimelfarb, which appeared in the October 2003 issue of Stocks & Commodities.
Formula Parameters:
Smoothing Length: 2
Thickness: 2
Bull Color: Color.blue
Bear Color: Color.red
Graph Type: Lines [Lines, Histogram]
Notes:
The formula is applied twice in the chart image to show the two types of display options. The related article is copyrighted material. If you are not a subscriber of Stocks & Commodities, please visit www.traders.com.
Download File:
BullBearBalance.efs
EFS Code:
Description:
This indicator is based on Bull And Bear Balance Indicator by Vadim Gimelfarb, which appeared in the October 2003 issue of Stocks & Commodities.
Formula Parameters:
Smoothing Length: 2
Thickness: 2
Bull Color: Color.blue
Bear Color: Color.red
Graph Type: Lines [Lines, Histogram]
Notes:
The formula is applied twice in the chart image to show the two types of display options. The related article is copyrighted material. If you are not a subscriber of Stocks & Commodities, please visit www.traders.com.
Download File:
BullBearBalance.efs
EFS Code:
PHP Code:
/*****************************************************************

Provided By : eSignal. (c) Copyright 2004

Study:        Bull And Bear Balance Indicator, by Vadim Gimelfarb

Version:      2.0


9/8/2004


Notes:


Formula Parameters:                 Default:

    Smoothing Length                2

    Thickness                       2

    Bull Color                      Color.blue

    Bear Color                      Color.red

    Graph Type                      Lines

        [Lines, Histogram]

*****************************************************************/


function preMain() {

    setStudyTitle("Bull And Bear Balance ");

    setShowTitleParameters(false);

    setCursorLabelName("Bull", 0);

    setCursorLabelName("Bear", 1);


    setDefaultBarFgColor(Color.blue, 0);

    setDefaultBarFgColor(Color.red, 1);


    addBand(0, PS_SOLID, 1, Color.grey, "zero");


    var fp1 = new FunctionParameter("nLength", FunctionParameter.NUMBER);

    fp1.setName("Smoothing Length");

    fp1.setLowerLimit(1);

    fp1.setDefault(2);


    var fp2 = new FunctionParameter("nThick", FunctionParameter.NUMBER);

    fp2.setName("Thickness");

    fp2.setLowerLimit(1);

    fp2.setDefault(2);


    var fp3 = new FunctionParameter("cColor0", FunctionParameter.COLOR);

    fp3.setName("Bull Color");

    fp3.setDefault(Color.blue);


    var fp4 = new FunctionParameter("cColor1", FunctionParameter.COLOR);

    fp4.setName("Bear Color");

    fp4.setDefault(Color.red);


    var fp5 = new FunctionParameter("sType", FunctionParameter.STRING);

    fp5.setName("Graph Type");

    fp5.addOption("Lines");

    fp5.addOption("Histogram");

    fp5.setDefault("Lines");

}


var bEdit = true;

var nCntr = 0;

var bNew = false;

var nPB = null;

var nPB1 = null;

var nBull = null;

var nBear = null;

var nBullMA = null;

var nBearMA = null;

var nBullMA1 = null;

var nBearMA1 = null;

var aBull = null;

var aBear = null;


function main(nLength, nThick, cColor0, cColor1, sType) {

    if (bEdit == true) {

        aBull = new Array(nLength);

        aBear = new Array(nLength);

        setDefaultBarThickness(nThick, 0);

        setDefaultBarThickness(nThick, 1);

        setDefaultBarFgColor(cColor0, 0);

        setDefaultBarFgColor(cColor1, 1);

        switch (sType) {

            case "Lines" :

                setCursorLabelName("Bull", 0);

                setCursorLabelName("Bear", 1);

                setPlotType(PLOTTYPE_LINE, 0);

                setPlotType(PLOTTYPE_LINE, 1);

                break;

            case "Histogram" :

                setCursorLabelName("Power Balance", 0);

                setCursorLabelName("Power Balance", 1);

                setPlotType(PLOTTYPE_INSTANTCOLORLINE, 0);

                setPlotType(PLOTTYPE_HISTOGRAM, 1);

                break;

        }

        bEdit = false;

    }


    if (getBarState() == BARSTATE_NEWBAR) {

        nPB1 = nPB;

        nBullMA1 = nBullMA;

        nBearMA1 = nBearMA;

        if (nBull != null) {

            aBull.pop();

            aBull.unshift(nBull);

        }

        if (nBear != null) {

            aBear.pop();

            aBear.unshift(nBear);

        }

        nCntr++;

        if (nCntr > 200) nCntr = 0;

    }


    var C = close(0);

    var O = open(0);

    var H = high(0);

    var L = low(0);


    var C1 = close(-1);

    if (C1 == null) return;


    //Bull Power

    nBull = null;

    if (C < O) {

        if (C1 < O) {

            nBull = Math.max(H-C1, C-L);

        } else {

            nBull = Math.max(H-O, C-L);

        }

    } else if (C > O) {

        if (C1 > O) {

            nBull = (H-L);

        } else {

            nBull = Math.max(O-C1, H-L);

        }

    } else if (H-C > C-L) {

        if (C1 < O) {

            nBull = Math.max(H-C1, C-L);

        } else {

            nBull = (H-O);

        }

    } else if (H-C < C-L) {

        if (C1 > O) {

            nBull = (H-L);

        } else {

            nBull = Math.max(O-C1, H-L);

        }

    } else if (C1 > O) {

        nBull = Math.max(H-O, C-L);

    } else if (C1 < O) {

        nBull = Math.max(O-C1, H-L);

    } else {

        nBull = Math.max(O-C1, H-L);

    }

    aBull[0] = nBull;


    //Bear Power

    nBear = null;

    if (C < O) {

        if (C1 > O) {

            nBear = Math.max(C1-O, H-L);

        } else {

            nBear = (H-L);

        }

    } else if (C > O) {

        if (C1 > O) {

            nBear = Math.max(C1-L, H-C);

        } else {

            nBear = Math.max(O-L, H-C);

        }

    } else if (H-C > C-L) {

        if (C1 > O) {

            nBear = Math.max(C1-O, H-L);

        } else {

            nBear = (H-L);

        }

    } else if (H-C < C-L) {

        if (C1 > O) {

            nBear = Math.max(C1-L, H-C);

        } else {

            nBear = (O-L);

        }

    } else if (C1 > O) {

        nBear = Math.max(C1-O, H-L);

    } else if (C1 < O) {

        nBear = Math.max(O-L, H-C);

    } else {

        nBear = (H-L);

    }

    aBear[0] = nBear;


    // Smoothing

    var dSumBull = 0;

    var dSumBear = 0;

    for (var i = 0; i < nLength; i++) {

        dSumBull += aBull[i];

        dSumBear += aBear[i];

    }

    nBullMA = dSumBull/nLength;

    nBearMA = dSumBear/nLength;


    // Alert Arrows

    if (sType == "Histogram") {

        nPB = (nBullMA - nBearMA);

        nBullMA = nBearMA = nPB;

        if (nPB >= 0) {

            setBarFgColor(cColor0, 0);

            setBarFgColor(cColor0, 1);

        } else {

            setBarFgColor(cColor1, 0);

            setBarFgColor(cColor1, 1);

        }

        if (nPB >= 0 && nPB1 < 0) {

            bNew = true;

            drawShapeRelative(0, 5, Shape.UPARROW, null, Color.green, Shape.TOP|Shape.RELATIVETOTOP, "up"+nCntr);

        } else if (bNew == true) {

            removeShape("up"+nCntr);

        }

        if (nPB <= 0 && nPB1 > 0) {

            bNew = true;

            drawShapeRelative(0, 5, Shape.DOWNARROW, null, Color.red, Shape.BOTTOM|Shape.RELATIVETOBOTTOM, "dn"+nCntr);

        } else if (bNew == true) {

            removeShape("dn"+nCntr);

        }

    } else {

        if (nBullMA >= nBearMA && nBullMA1 < nBearMA1) {

            bNew = true;

            drawShapeRelative(0, 5, Shape.UPARROW, null, Color.green, Shape.TOP|Shape.RELATIVETOTOP, "up"+nCntr);

        } else if (bNew == true) {

            removeShape("up"+nCntr);

        }

        if (nBullMA <= nBearMA && nBullMA1 > nBearMA1) {

            bNew = true;

            drawShapeRelative(0, 5, Shape.DOWNARROW, null, Color.red, Shape.BOTTOM|Shape.RELATIVETOBOTTOM, "dn"+nCntr);

        } else if (bNew == true) {

            removeShape("dn"+nCntr);

        }

    }


    return new Array(nBullMA, nBearMA);

}