 Tweet
Tweet
File Name: TRsV.efs
Description:
This indicator is based on Using Volume to Detect Shifts In Power by Vadim Gimelfarb, which appeared in the November 2004 issue of Stocks & Commodities.
Formula Parameters:
ATR Length: 1
TRsV Thickness: 2
Volume Thickness: 3
TRsV Color: Color.red
Volume Color: Color.blue
Display Volume: true
Notes:
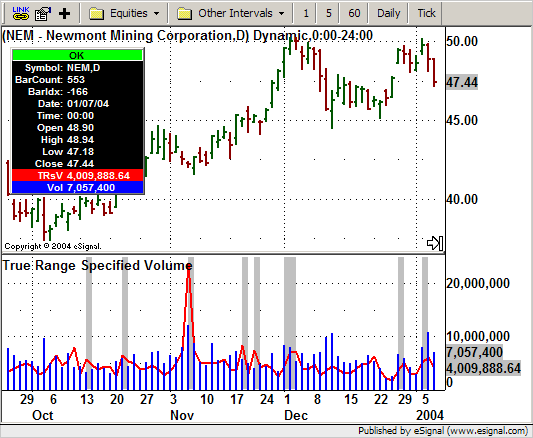
The background of the bar changes to light grey when the current TRsV value exceeds the prior bar's value by more than 1.5. The related article is copyrighted material. If you are not a subscriber of Stocks & Commodities, please visit www.traders.com.
Download File:
TRsV.efs
EFS Code:
Description:
This indicator is based on Using Volume to Detect Shifts In Power by Vadim Gimelfarb, which appeared in the November 2004 issue of Stocks & Commodities.
Formula Parameters:
ATR Length: 1
TRsV Thickness: 2
Volume Thickness: 3
TRsV Color: Color.red
Volume Color: Color.blue
Display Volume: true
Notes:
The background of the bar changes to light grey when the current TRsV value exceeds the prior bar's value by more than 1.5. The related article is copyrighted material. If you are not a subscriber of Stocks & Commodities, please visit www.traders.com.
Download File:
TRsV.efs
EFS Code:
PHP Code:
/************************************

Provided By : eSignal. (c) Copyright 2004

Study:        Using Volume to Detect Shifts In Power, by Vadim Gimelfarb

Version:      1.0


9/3/2004


Notes:

The background of the bar changes to light grey when the current

TRsV value exceeds the prior bar's value by more than 1.5.


Formula Parameters:                 Default:

ATR Length                          1

TRsV Thickness                      2

Volume Thickness                    3

TRsV Color                          Color.red

Volume Color                        Color.blue

Display Volume                      true

************************************/


function preMain() {

    setStudyTitle("True Range Specified Volume ");


    // TRsV

    setCursorLabelName("TRsV", 0);

    setDefaultBarFgColor(Color.red, 0);

    setDefaultBarThickness(2, 0);


    // Volume

    setCursorLabelName("Vol", 1);

    setDefaultBarFgColor(Color.blue, 1);

    setDefaultBarThickness(3, 1);

    setPlotType(PLOTTYPE_HISTOGRAM, 1);


    setShowTitleParameters(false);


    var fp1 = new FunctionParameter("nTRlength", FunctionParameter.NUMBER);

    fp1.setName("ATR Length");

    fp1.setLowerLimit(0);

    fp1.setDefault(1);


    var fp2 = new FunctionParameter("nThick0", FunctionParameter.NUMBER);

    fp2.setName("TRsV Thickness");

    fp2.setLowerLimit(1);

    fp2.setDefault(2);


    var fp2a = new FunctionParameter("nThick1", FunctionParameter.NUMBER);

    fp2a.setName("Volume Thickness");

    fp2a.setLowerLimit(1);

    fp2a.setDefault(3);


    var fp3 = new FunctionParameter("cColor0", FunctionParameter.COLOR);

    fp3.setName("TRsV Color");

    fp3.setDefault(Color.red);


    var fp3a = new FunctionParameter("cColor1", FunctionParameter.COLOR);

    fp3a.setName("Volume Color");

    fp3a.setDefault(Color.blue);


    var fp4 = new FunctionParameter("bVol", FunctionParameter.BOOLEAN);

    fp4.setName("Display Volume");

    fp4.setDefault(true);

}


var bEdit = true;

var nCntr = 0;

var vATR = null;

var nTRsV = null;

var nTRsV1 = null;


function main(nTRlength, nThick0, nThick1, cColor0, cColor1, bVol) {

    if (bEdit == true) {

        setDefaultBarFgColor(cColor0, 0);

        setDefaultBarThickness(nThick0, 0);

        setDefaultBarFgColor(cColor1, 1);

        setDefaultBarThickness(nThick1, 1);

        if (vATR == null) vATR = new ATRStudy(nTRlength);

        bEdit = false;

    }


    if (getBarState() == BARSTATE_NEWBAR && nTRsV != null) {

        nTRsV1 = nTRsV;

        nCntr++;

        if (nCntr > 200) nCntr = 0;

    }


    bVol = eval(bVol);


    var nATR = vATR.getValue(ATRStudy.ATR);

    if (nATR == null) return;


    var nVol = volume();

    if (nATR == 0) {

        nTRsV = 0;

    } else {

        nTRsV = nVol / nATR;

    }


    if (nTRsV1 != null) {

        if ( (nTRsV / nTRsV1) > 1.5) setBarBgColor(Color.lightgrey);

    }


    if (!bVol) nVol += "";


    return new Array(nTRsV, nVol);

}