 Tweet
Tweet
File Names: BBZ.efs, BBZosc.efs
Description:
These studies are based on the March 2006 article, Trading Trends with Bollinger Bands Z-Test, by Jacinta Chan.
Formula Parameters:
BBZ.efs
Price Source: Close
_ [Open, High, Low, Close, HL/2, HLC/3, OHLC/4]
Number of Periods: 20
Number of Standard Deviations: 1
BBZosc.efs
Price Source: Close
_ [Open, High, Low, Close, HL/2, HLC/3, OHLC/4]
Number of Periods: 20
Number of Standard Deviations: 1
Notes:
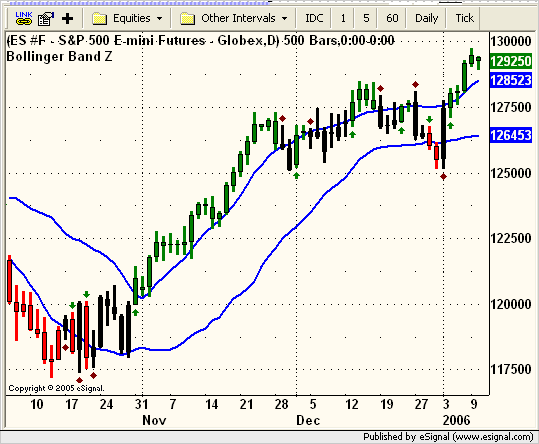
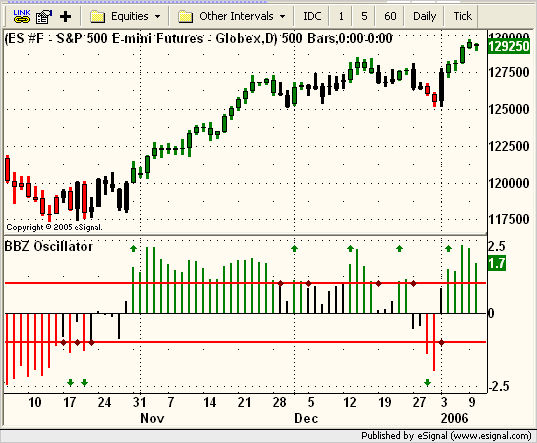
The BBZosc study plots the BBZ series as a non-price study histogram. The BBZ study plots as a price study and includes the Bollinger Bands for reference. The trade signals generated by both studies are based on the crossing the +1/-1 thresholds of the BBZ series. Both studies generate the same signals and are compatible for back testing and real-time usage. In real-time the studies will produce audible alerts for the trade signals and will draw green up/down arrows for the entry signals. Red diamonds will be drawn for the exit signals. Through the Edit Studies option in the Advanced Chart, there are several study parameters that may be customized for both studies. The Price Source for the study is set to the Close as the default but may be set to a number of options (open, high, low, close, hl2, hlc2 and ohlc4). There are also study parameters for the Number of Periods and Standard Deviations for the BBZ with defaults of 20 and 1, respectively. The BBZ study uses these two parameters for the Bollinger Bands settings as well. The related article is copyrighted material. If you are not a subscriber of Stocks & Commodities, please visit www.traders.com.
Download File:
BBZ.efs
BBZosc.efs
EFS Code:
Description:
These studies are based on the March 2006 article, Trading Trends with Bollinger Bands Z-Test, by Jacinta Chan.
Formula Parameters:
BBZ.efs
Price Source: Close
_ [Open, High, Low, Close, HL/2, HLC/3, OHLC/4]
Number of Periods: 20
Number of Standard Deviations: 1
BBZosc.efs
Price Source: Close
_ [Open, High, Low, Close, HL/2, HLC/3, OHLC/4]
Number of Periods: 20
Number of Standard Deviations: 1
Notes:
The BBZosc study plots the BBZ series as a non-price study histogram. The BBZ study plots as a price study and includes the Bollinger Bands for reference. The trade signals generated by both studies are based on the crossing the +1/-1 thresholds of the BBZ series. Both studies generate the same signals and are compatible for back testing and real-time usage. In real-time the studies will produce audible alerts for the trade signals and will draw green up/down arrows for the entry signals. Red diamonds will be drawn for the exit signals. Through the Edit Studies option in the Advanced Chart, there are several study parameters that may be customized for both studies. The Price Source for the study is set to the Close as the default but may be set to a number of options (open, high, low, close, hl2, hlc2 and ohlc4). There are also study parameters for the Number of Periods and Standard Deviations for the BBZ with defaults of 20 and 1, respectively. The BBZ study uses these two parameters for the Bollinger Bands settings as well. The related article is copyrighted material. If you are not a subscriber of Stocks & Commodities, please visit www.traders.com.
Download File:
BBZ.efs
BBZosc.efs
EFS Code:
PHP Code:
/***************************************

Provided By : eSignal (c) Copyright 2006

Description:  Trading Trends with Bollinger Bands Z - by Jacinta Chan


Version 1.0  01/05/2006


Notes:

* March 2006 Issue of Stocks and Commodities Magazine

* This study is configured for Back Testing and real-

    time usage.

* This study uses the z-score indicator and plots as

  a price study.

* Study requires version 7.9.1 or higher.


Formula Parameters:                 Defaults:

Price Source                        Close

    [Open, High, Low, Close, HL/2, HLC/3, OHLC/4]

Number of Periods                   20

Number of Standard Deviations       1

***************************************/


function preMain() {

    setPriceStudy(true);

    setStudyTitle("Bollinger Band Z");

    setShowTitleParameters(false);

    setCursorLabelName("Upper BB", 0);

    setCursorLabelName("Lower BB", 1);

    setCursorLabelName("BBZ", 2);

    setDefaultBarThickness(2, 0);

    setDefaultBarThickness(2, 1);

    setComputeOnClose();

    setColorPriceBars(true);

    setDefaultPriceBarColor(Color.grey);


    var fp1 = new FunctionParameter("sPrice", FunctionParameter.STRING);

        fp1.setName("Price Source");

        fp1.addOption("Open");

        fp1.addOption("High");

        fp1.addOption("Low");

        fp1.addOption("Close");

        fp1.addOption("HL/2");

        fp1.addOption("HLC/3");

        fp1.addOption("OHLC/4");

        fp1.setDefault("Close");

    var fp2 = new FunctionParameter("nLength", FunctionParameter.NUMBER);

        fp2.setName("Number of Periods");

        fp2.setLowerLimit(1);

        fp2.setDefault(20);

    var fp3 = new FunctionParameter("nStdev", FunctionParameter.NUMBER);

        fp3.setName("Number of Standard Deviations");

        fp3.setLowerLimit(0);

        fp3.setDefault(1);

}


var bVersion = null;

var bInit = false;


var xUprBB = null;  // Upper Bollinger Band Series

var xLwrBB = null;  // Lower Bollinger Band Series

var xStdev = null;  // Standard Deviation Series

var xPrice = null;  // Price Source Series

var xMA    = null;  // Moving Average Series

var xZ     = null;  // Z-score Series

var nCntr  = 0;     // bar counter for shape tagIDs in doSignals()

var cLong  = Color.green;  // price bar color for long position

var cShort = Color.red;    // price bar color for short position

var cFlat  = Color.black;  // price bar color for no position

var vColor = Color.grey;   // current bar color


function main(sPrice, nLength, nStdev) {


    if (bVersion == null) bVersion = verify();

    if (bVersion == false) return;


    if (bInit == false) {

        xMA = sma(nLength);

        switch (sPrice) {

            case "Open" :

                xPrice = open();

                break;

            case "High" :

                xPrice = high();

                break;

            case "Low" :

                xPrice = low();

                break;

            case "Close" :

                xPrice = close();

                break;

            case "HL/2" :

                xPrice = hl2();

                break;

            case "HLC/3" :

                xPrice = hlc3();

                break;

            case "OHLC/4" :

                xPrice = ohlc4();

                break;

            default: xPrice = close();

        }

        xUprBB = upperBB(nLength, nStdev, xPrice);

        xLwrBB = lowerBB(nLength, nStdev, xPrice);

        xStdev = efsInternal("Stdev", nLength, xPrice);

        xZ = efsInternal("calcZ", xPrice, xMA, xStdev, nStdev)

        bInit = true;

    }


    var nState = getBarState();

    var Z = xZ.getValue(0);

    var Z_1 = xZ.getValue(-1);

    if (Z_1 == null) return;


    if (nState == BARSTATE_NEWBAR) {

        nCntr++;

        bExit = false;

    }


    doSignals(Z, Z_1);

    setPriceBarColor(vColor);


    if (getCurrentBarIndex() < 0) doBackTest(Z, Z_1);


    return new Array(xUprBB.getValue(0), xLwrBB.getValue(0), Z.toFixed(2));

}


/***** Support Functions *****/


var bExit = false;  // Flags an exit trade to prevent re-entry on

                    // the same bar.


function doBackTest(z, z_1) {

    // long exit

    if (Strategy.isLong()) {

        if (z_1 >= 1 && z < 1) {

            Strategy.doSell("Long Stop",

                Strategy.CLOSE, Strategy.THISBAR);

            bExit = true;

        }

    }


    // short exit

    if (Strategy.isShort()) {

        if (z_1 <= -1 && z > -1) {

            Strategy.doCover("Short Stop",

                Strategy.CLOSE, Strategy.THISBAR);

            bExit = true;

        }

    }


    // long entry

    if (!Strategy.isLong() && bExit == false) {

        if (z_1 <= 1 && z > 1) Strategy.doLong("Long Entry",

            Strategy.CLOSE, Strategy.THISBAR);

    }


    // short entry

    if (!Strategy.isShort() && bExit == false) {

        if (z_1 >= -1 && z < -1) Strategy.doShort("Short Entry",

            Strategy.CLOSE, Strategy.THISBAR);

    }


    return;

}


function doSignals(z, z_1) {

    // long entry

    if (z_1 <= 1 && z > 1) {

        drawShape(Shape.UPARROW, BelowBar1, Color.green, "upEntry"+nCntr);

        Alert.playSound("ding.wav");

        vColor = cLong;

    }


    // short entry

    if (z_1 >= -1 && z < -1) {

        drawShape(Shape.DOWNARROW, AboveBar1, Color.green, "dnEntry"+nCntr);

        Alert.playSound("ding.wav");

        vColor = cShort;

    }


    // long exit

    if (z_1 >= 1 && z < 1) {

        drawShape(Shape.DIAMOND, AboveBar1, Color.maroon, "upExit"+nCntr);

        Alert.playSound("train.wav");

        vColor = cFlat;

    }


    // short exit

    if (z_1 <= -1 && z > -1) {

        drawShape(Shape.DIAMOND, BelowBar1, Color.maroon, "dnExit"+nCntr);

        Alert.playSound("train.wav");

        vColor = cFlat;

    }


    return;

}


function Stdev(n, source) {

    if (source.getValue(-n) == null) return null;


    var sumX = 0;

    var sumX2 = 0;

    for (i = 0; i < n; ++i) {

        sumX += source.getValue(-i);

        sumX2 += (source.getValue(-i) * source.getValue(-i))

    }

    var meanX = (sumX/n);

    var stdev = Math.sqrt((sumX2/n) - (meanX*meanX));


    return stdev;

}


function calcZ(c, m, s, n) {

    if (c.getValue(0) == null || m.getValue(0) == null ||

        s.getValue(0) == null) return null;

    var z = (c.getValue(0) - m.getValue(0)) / (s.getValue(0) * n);

    return z;

}


function verify() {

    var b = false;

    if (getBuildNumber() < 730) {

        drawTextAbsolute(5, 35, "This study requires version 7.9.1 or later.",

            Color.white, Color.blue, Text.RELATIVETOBOTTOM|Text.RELATIVETOLEFT|Text.BOLD|Text.LEFT,

            null, 13, "error");

        drawTextAbsolute(5, 20, "Click HERE to upgrade.@URL=http://www.esignal.com/download/default.asp",

            Color.white, Color.blue, Text.RELATIVETOBOTTOM|Text.RELATIVETOLEFT|Text.BOLD|Text.LEFT,

            null, 13, "upgrade");

        return b;

    } else {

        b = true;

    }


    return b;

}


/***************************************

Provided By : eSignal (c) Copyright 2006

Description:  Trading Trends with Bollinger Bands Z - by Jacinta Chan


Version 1.0  01/05/2006


Notes:

* March 2006 Issue of Stocks and Commodities Magazine

* This study is configured for Back Testing and real-

    time usage.

* This study uses the z-score indicator and plots as

  a non-price study.

* Study requires version 7.9.1 or higher.


Formula Parameters:                 Defaults:

Price Source                        Close

    [Open, High, Low, Close, HL/2, HLC/3, OHLC/4]

Number of Periods                   20

Number of Standard Deviations       1

***************************************/


//  Code has been omitted here due to length restrictions.

//  Please open the formula in the EFS Editor to view the code.