 Tweet
Tweet
File Name: Colby_StochEmaFilter.efs
Description:
This study is based on the December 2006 article, Stochastics With Long Term EMA Filter, by Robert Colby.
Formula Parameters:
Stoch Upper Band: 70
Stoch Lower Band: 30
EMA Periods: 271
StochK Periods: 7
StochK Smoothing: 3
Notes:
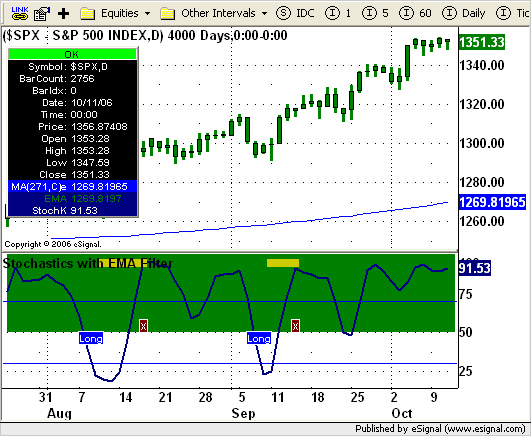
This study requires at least 271 bars of data. As a non-price study, the formula uses the EMA study as part of the conditions for the trade signal but cannot plot the EMA on the price chart simultaneously with the StochK. If desired, add the EMA study to the price pane with the EMA from Basic Studies menu (use Length 271 with Close as the Source). When the Close is above the 271-period EMA the top half of the study pane's background will be colored green. When the Close is below the 271-period EMA, the bottom half of the study pane's background will be colored red. In addition to the background of the study pane, the price bars will be will also be colored to match the background coloring scheme. The related article is copyrighted material. If you are not a subscriber of Stocks & Commodities, please visit www.traders.com.
Download File:
Colby_StochEmaFilter.efs
EFS Code:
Description:
This study is based on the December 2006 article, Stochastics With Long Term EMA Filter, by Robert Colby.
Formula Parameters:
Stoch Upper Band: 70
Stoch Lower Band: 30
EMA Periods: 271
StochK Periods: 7
StochK Smoothing: 3
Notes:
This study requires at least 271 bars of data. As a non-price study, the formula uses the EMA study as part of the conditions for the trade signal but cannot plot the EMA on the price chart simultaneously with the StochK. If desired, add the EMA study to the price pane with the EMA from Basic Studies menu (use Length 271 with Close as the Source). When the Close is above the 271-period EMA the top half of the study pane's background will be colored green. When the Close is below the 271-period EMA, the bottom half of the study pane's background will be colored red. In addition to the background of the study pane, the price bars will be will also be colored to match the background coloring scheme. The related article is copyrighted material. If you are not a subscriber of Stocks & Commodities, please visit www.traders.com.
Download File:
Colby_StochEmaFilter.efs
EFS Code:
PHP Code:
/***************************************

Provided By : eSignal (c) Copyright 2006

Description:  Stochastics With Long Term EMA Filter

              by Robert Colby


Version 1.0  10/09/2006


Notes:

* Dec 2006 Issue of Stocks and Commodities Magazine

* Study requires at least 271 bars of data.

* As a non-price study, the formula uses the EMA study as

    part of the conditions for the trade signal but cannot

    plot the EMA on the price chart simultaneously with the StochK.

    If desired, add the EMA study to the price pane with the EMA

    from Basic Studies menu (use Length 271 with Close as the Source).

* When the Close is above the 271-period EMA the top half of the study

    pane's background will be colored green.  When the Close is below

    the 271-period EMA, the bottom half of the study pane's background

    will be colored red.  In addition to the background of the study

    pane, the price bars will be will also be colored to match the

    background coloring scheme.


Formula Parameters:                     Default:

Stoch Upper Band                        70

Stoch Lower Band                        30

EMA Periods                             271

StochK Periods                          7

StochK Smoothing                        3

*****************************************************************/


function preMain() {

    setStudyTitle("Stochastics with EMA Filter ");

    setCursorLabelName("EMA", 0);

    setCursorLabelName("StochK", 1);

    setDefaultBarFgColor(Color.navy, 1);

    setDefaultBarThickness(2, 1);

    setShowTitleParameters(false);

    setColorPriceBars(true);

    setDefaultPriceBarColor(Color.grey);


    var fp1 = new FunctionParameter("nUpperBand", FunctionParameter.NUMBER);

        fp1.setName("Stoch Upper Band");

        fp1.setLowerLimit(0);

        fp1.setDefault(70);


    var fp2 = new FunctionParameter("nLowerBand", FunctionParameter.NUMBER);

        fp2.setName("Stoch Lower Band");

        fp2.setLowerLimit(0);

        fp2.setDefault(30);


    var fp3 = new FunctionParameter("nMAlen", FunctionParameter.NUMBER);

        fp3.setName("EMA Periods");

        fp3.setLowerLimit(1);

        fp3.setDefault(271);


    var fp4 = new FunctionParameter("nKlen", FunctionParameter.NUMBER);

        fp4.setName("StochK Periods");

        fp4.setLowerLimit(1);

        fp4.setDefault(7);


    var fp5 = new FunctionParameter("nKsma", FunctionParameter.NUMBER);

        fp5.setName("StochK Smoothing");

        fp5.setLowerLimit(1);

        fp5.setDefault(3);

}


// Global Variables

var bVersion  = null;    // Version flag

var bInit     = false;   // Initialization flag

var xMA       = null;    // EMA series

var xStochK   = null;    // StochK series


// Strategy Variables

var vPosition = 0;      // position status (1=long, 0=flat, -1=short)

var bRealTime = false;  // back testing flag


function main(nUpperBand, nLowerBand, nMAlen, nKlen, nKsma) {

    if (bVersion == null) bVersion = verify();

    if (bVersion == false) return;


    var nState = getBarState();

    var nIndex = getCurrentBarIndex();

    var c      = close(0);

    var c_1    = close(-1);


    //Initialization

    if (bInit == false) {

        addBand(nUpperBand, PS_SOLID, 1, Color.blue, "upper");

        addBand(nLowerBand, PS_SOLID, 1, Color.blue, "lower");

        xMA = ema(nMAlen);

        xStochK = stochK(nKlen, nKsma, 1);

        bInit = true;

    }


    var nEMA   = xMA.getValue(0);

    var nEMA_1 = xMA.getValue(-1);

    var nK     = xStochK.getValue(0);

    var nK_1   = xStochK.getValue(-1);

    if (nEMA_1 == null || nK_1 == null) return;  // null check


    if (nIndex == 0) bRealTime = true;


    //Coloring scheme for close vs. EMA

    if (c >= nEMA) {

        setBarBgColor(Color.green, 0, 100, 50);

        setPriceBarColor(Color.green);

    } else {

        setBarBgColor(Color.red, 0, 50, 0);

        setPriceBarColor(Color.red);

    }


    // Exit Signals

    if (nState == BARSTATE_NEWBAR && vPosition != 0) {

        if (vPosition == 1) {           // long

            if (c_1 < nEMA_1 || nK_1 > nUpperBand) {

                drawTextRelative(0, 50, "X", Color.white, Color.maroon,

                    Text.CENTER|Text.FRAME|Text.BOLD|Text.BOTTOM, null, 10);

                drawShape(Shape.SQUARE, TopRow1, Color.khaki);

                vPosition = 0;

                if (bRealTime == false) { // back test

                    Strategy.doSell("Long Exit", Strategy.MARKET, Strategy.THISBAR);

                }

            }

        } else if (vPosition == -1) {   // short

            if (c_1 > nEMA_1 || nK_1 < nLowerBand) {

                drawTextRelative(0, 50, "X", Color.white, Color.maroon,

                    Text.CENTER|Text.FRAME|Text.BOLD|Text.TOP, null, 10);

                drawShape(Shape.SQUARE, BottomRow1, Color.khaki);

                vPosition = 0;

                if (bRealTime == false) { // back test

                    Strategy.doCover("Short Exit", Strategy.MARKET, Strategy.THISBAR);

                }

            }

        }

    }


    // Entry Signals

    if (nState == BARSTATE_NEWBAR) {

        if (vPosition != 1) {  // long

            if (nK_1 < nLowerBand && c_1 > nEMA_1) {

                drawTextRelative(0, 50, "Long", Color.white, Color.blue,

                    Text.RIGHT|Text.FRAME|Text.BOLD|Text.TOP, null, 10);

                vPosition = 1;

                if (bRealTime == false) { // back test

                    Strategy.doLong("Long Entry", Strategy.MARKET, Strategy.THISBAR);

                }

            }

        }

        if (vPosition != -1) {  // short

            if (nK_1 > nUpperBand && c_1 < nEMA_1) {

                drawTextRelative(0, 50, "Short", Color.white, Color.blue,

                    Text.RIGHT|Text.FRAME|Text.BOLD|Text.BOTTOM, null, 10);

                vPosition = -1;

                if (bRealTime == false) { // back test

                    Strategy.doShort("Short Entry", Strategy.MARKET, Strategy.THISBAR);

                }

            }

        }

    }


    // Position status

    if (vPosition == 1) {

        drawShape(Shape.SQUARE, TopRow1, Color.khaki);

    } else if (vPosition == -1) {

        drawShape(Shape.SQUARE, BottomRow1, Color.khaki);

    }


    return new Array(nEMA.toFixed(4), nK);

}


function verify() {

    var b = false;

    if (getBuildNumber() < 779) {

        drawTextAbsolute(5, 35, "This study requires version 8.0 or later.",

            Color.white, Color.blue, Text.RELATIVETOBOTTOM|Text.RELATIVETOLEFT|Text.BOLD|Text.LEFT,

            null, 13, "error");

        drawTextAbsolute(5, 20, "Click HERE to upgrade.@URL=http://www.esignal.com/download/default.asp",

            Color.white, Color.blue, Text.RELATIVETOBOTTOM|Text.RELATIVETOLEFT|Text.BOLD|Text.LEFT,

            null, 13, "upgrade");

        return b;

    } else {

        b = true;

    }


    return b;

}