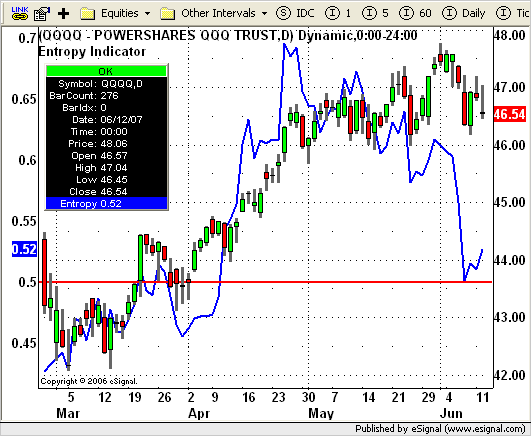
File Name: Entropy.efs
Description:
This study is based on the Nov 2006 article, Entropic Analysis of Equity Prices, by Ron McEwan for the August 2007 issue.
Formula Parameters:
Period: 30
Color: blue
Thickness: 2
Notes:
The study is a non-price study by default. To overlay the study on the price window, hold down the Shift key and then drag and drop the indicator pane onto the price window. The related article is copyrighted material. If you are not a subscriber of Stocks & Commodities, please visit www.traders.com.
Download File:
Entropy.efs

EFS Code:
Description:
This study is based on the Nov 2006 article, Entropic Analysis of Equity Prices, by Ron McEwan for the August 2007 issue.
Formula Parameters:
Period: 30
Color: blue
Thickness: 2
Notes:
The study is a non-price study by default. To overlay the study on the price window, hold down the Shift key and then drag and drop the indicator pane onto the price window. The related article is copyrighted material. If you are not a subscriber of Stocks & Commodities, please visit www.traders.com.
Download File:
Entropy.efs

EFS Code:
PHP Code:
/***************************************

Provided By :

    eSignal (Copyright © eSignal), a division of Interactive Data

    Corporation. 2007. All rights reserved. This sample eSignal

    Formula Script (EFS) is for educational purposes only and may be

    modified and saved under a new file name.  eSignal is not responsible

    for the functionality once modified.  eSignal reserves the right

    to modify and overwrite this EFS file with each new release.


Description:  Entropic Analysis of Equity Prices

              by Ron McEwan


Version 1.0  6/11/2007


Notes:

* Code provided for Aug 2007 Issue of Stocks and Commodities Magazine

    based on McEwan's article from the Nov 2006 issue.

* Study requires version 8.0 or later.


Formula Parameters:                     Default:

Period                                  30

Color                                   blue

Thickness                               2

***************************************/


function preMain() {

    setStudyTitle("Entropy Indicator ");

    setShowTitleParameters(false);

    setCursorLabelName("Entropy", 0);

    addBand(0.5, PS_SOLID, 2, Color.red, "band");


    var fp1 = new FunctionParameter("nP", FunctionParameter.NUMBER);

        fp1.setName("Periods");

        fp1.setLowerLimit(1);

        fp1.setDefault(30);

    var fp2 = new FunctionParameter("cColor", FunctionParameter.COLOR);

        fp2.setName("Color");

        fp2.setDefault(Color.blue);

    var fp3 = new FunctionParameter("nThick", FunctionParameter.NUMBER);

        fp3.setName("Thickness");

        fp3.setLowerLimit(1);

        fp3.setDefault(2);

}


// Global Variables

var bVersion  = null;    // Version flag

var bInit     = false;   // Initialization flag


var xLn     = null;

var xAvg    = null;

var xRms    = null;

var xP      = null;


function main(nP, cColor, nThick) {

    if (bVersion == null) bVersion = verify();

    if (bVersion == false) return;


    //Initialization

    if (bInit == false) {

        setDefaultBarFgColor(cColor, 0);

        setDefaultBarThickness(nThick, 0);

        xLn  = efsInternal("calcLn");

        xAvg = sma(nP, xLn);

        xRms = efsInternal("calcRms", xLn, nP);

        xP   = efsInternal("calcP", xAvg, xRms);

        bInit = true;

    }


    var n = xP.getValue(0);

    if (n == null) return;


    return n;

}


function calcLn() {

    var c0 = close(0);

    var c1 = close(-1);

    if (c1 == null) return;


    return Math.log(c0/c1);

}


function calcRms(x, n) {

    if (x.getValue(-n) == null) return;


    var nSumSQ = 0;

    for (var i = 0; i < n; i++) {

        nSumSQ += Math.pow(x.getValue(-i), 2);

    }


    var nRms = Math.pow((nSumSQ / n), 0.5);


    return nRms;

}


function calcP(_xAvg, _xRms) {

    var nAvg0 = _xAvg.getValue(0);

    var nRms0 = _xRms.getValue(0);


    if (nAvg0 == null || nRms0 == null) return;


    return ((nAvg0 / nRms0) + 1) / 2;

}


function verify() {

    var b = false;

    if (getBuildNumber() < 779) {

        drawTextAbsolute(5, 35, "This study requires version 8.0 or later.",

            Color.white, Color.blue, Text.RELATIVETOBOTTOM|Text.RELATIVETOLEFT|Text.BOLD|Text.LEFT,

            null, 13, "error");

        drawTextAbsolute(5, 20, "Click HERE to upgrade.@URL=http://www.esignal.com/download/default.asp",

            Color.white, Color.blue, Text.RELATIVETOBOTTOM|Text.RELATIVETOLEFT|Text.BOLD|Text.LEFT,

            null, 13, "upgrade");

        return b;

    } else {

        b = true;

    }


    return b;

}