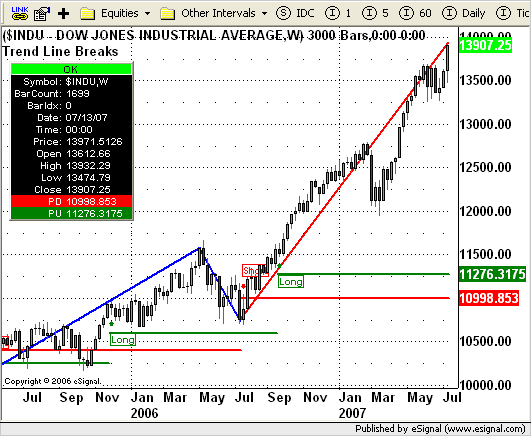
File Name: Trendline_Breaks.efs
Description:
This study is based on the Sept 2007 article, Trading Trendline Breaks, Part 2, by Sylvain Vervoort.
Formula Parameters:
Swing: # of Bars: 5
This is the minimum number of bars required to define a
swing point. This number is for both sides of the swing
point (i.e. 5 bars on the left and right of the swing bar).
Swing: Wave Type: % Retracement
(% Retracement, % Change in Price)
Swing: Wave Percentage: 30
The number 5 will be treated as 5.0%. The number 0.05 will
be treated as 0.0005%.
Swing High Price Source: High
Swing Low Price Source: Low
Line Thickness: 2
Confirmed Swing Line Color: Blue
Developing Swing Line Color: Red
Display Swing Labels: False
Display % Retracement Label: False
Number of Historical Labels: 100
Notes:
Study is a modified version of eSignal's RealTimeSwings.efs, which incorporates Vervoort's strategy signals based on ZigZag indicator.
Study provides historical analysis only, see author's notes in the article. The study displays the ZigZag indicator as well as the PU and PD price levels used for the trade signals, which are highlighted on the chart with "Long" and "Short" labels accompanied by up/down arrows. One difference with this EFS study that differs from the logic used in the article is that the forward looking aspect of the signals has been removed. To create realistic signals that may be evaluated in real time, the trade conditions are evaluated on the bars that confirm the previous swing points by the appropriate price action as defined by the formula parameters. The related article is copyrighted material. If you are not a subscriber of Stocks & Commodities, please visit www.traders.com.
Download File:
Trendline_Breaks.efs

EFS Code:
Description:
This study is based on the Sept 2007 article, Trading Trendline Breaks, Part 2, by Sylvain Vervoort.
Formula Parameters:
Swing: # of Bars: 5
This is the minimum number of bars required to define a
swing point. This number is for both sides of the swing
point (i.e. 5 bars on the left and right of the swing bar).
Swing: Wave Type: % Retracement
(% Retracement, % Change in Price)
Swing: Wave Percentage: 30
The number 5 will be treated as 5.0%. The number 0.05 will
be treated as 0.0005%.
Swing High Price Source: High
Swing Low Price Source: Low
Line Thickness: 2
Confirmed Swing Line Color: Blue
Developing Swing Line Color: Red
Display Swing Labels: False
Display % Retracement Label: False
Number of Historical Labels: 100
Notes:
Study is a modified version of eSignal's RealTimeSwings.efs, which incorporates Vervoort's strategy signals based on ZigZag indicator.
Study provides historical analysis only, see author's notes in the article. The study displays the ZigZag indicator as well as the PU and PD price levels used for the trade signals, which are highlighted on the chart with "Long" and "Short" labels accompanied by up/down arrows. One difference with this EFS study that differs from the logic used in the article is that the forward looking aspect of the signals has been removed. To create realistic signals that may be evaluated in real time, the trade conditions are evaluated on the bars that confirm the previous swing points by the appropriate price action as defined by the formula parameters. The related article is copyrighted material. If you are not a subscriber of Stocks & Commodities, please visit www.traders.com.
Download File:
Trendline_Breaks.efs

EFS Code:
PHP Code:
/***************************************


The amount of formula code exceeds the limits for

posting in the forums.  Please open the formula in

the EFS Editor to view the complete code.


***************************************/