 Tweet
Tweet
File Name: R-Squared.efs, LinReg_Slope.efs
Description:
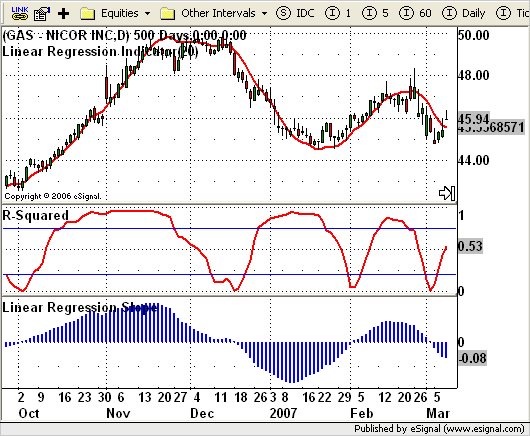
These studies are based on the December 2007 article, Confirming Price Trend, by Barbara Star PhD.
Formula Parameters:
R-Squared.efs
Periods: 8
Thickness: 2
Color: red
Display: Line
Upper Band: 0.75
Lower Band: 0.20
LinReg_Slope.efs
Periods: 8
Thickness: 2
Color: blue
Display: Line
Notes:
The linear regression formula that was also used in some of the chart images is also included in the formula library. Please see LinearRegressionIndicator.efs. The related article is copyrighted material. If you are not a subscriber of Stocks & Commodities, please visit www.traders.com.
Download File:
R-Squared.efs
LinReg_Slope.efs
EFS Code:
R-Squared.efs
LinReg_Slope.efs
Description:
These studies are based on the December 2007 article, Confirming Price Trend, by Barbara Star PhD.
Formula Parameters:
R-Squared.efs
Periods: 8
Thickness: 2
Color: red
Display: Line
Upper Band: 0.75
Lower Band: 0.20
LinReg_Slope.efs
Periods: 8
Thickness: 2
Color: blue
Display: Line
Notes:
The linear regression formula that was also used in some of the chart images is also included in the formula library. Please see LinearRegressionIndicator.efs. The related article is copyrighted material. If you are not a subscriber of Stocks & Commodities, please visit www.traders.com.
Download File:
R-Squared.efs
LinReg_Slope.efs
EFS Code:
R-Squared.efs
PHP Code:
/*****************************************************************

Provided By : eSignal. (c) Copyright 2004

Study:        R-Squared

Version:      1.0


11/5/2006


Formula Parameters:                 Defaults:

    Periods                         8

    Thickness                       2

    Color                           red

    Display                         Line

    Upper Band                      0.75

    Lower Band                      0.20

*****************************************************************/


function preMain() {

    setStudyTitle("R-Squared ");

    setCursorLabelName("R-Squared", 0);

    setDefaultBarFgColor(Color.red, 0);

    setDefaultBarThickness(2, 0);

    setShowTitleParameters(false);


    var fp10 = new FunctionParameter("nLRlen", FunctionParameter.NUMBER);

        fp10.setName("Periods");

        fp10.setLowerLimit(1);

        fp10.setDefault(8);


    var fp20 = new FunctionParameter("nLRThickness", FunctionParameter.NUMBER);

        fp20.setName("Thickness");

        fp20.setLowerLimit(1);

        fp20.setDefault(2);


    var fp30 = new FunctionParameter("nLRColor", FunctionParameter.COLOR);

        fp30.setName("Color");

        fp30.setDefault(Color.red);

    var fp40 = new FunctionParameter("sDisplay", FunctionParameter.STRING);

        fp40.setName("Display");

        fp40.addOption("Line");

        fp40.addOption("Histogram");

        fp40.setDefault("Line");

    var fp50 = new FunctionParameter("nUpper", FunctionParameter.NUMBER);

        fp50.setName("Upper Band");

        fp50.setDefault(0.75);

    var fp60 = new FunctionParameter("nLower", FunctionParameter.NUMBER);

        fp60.setName("Lower Band");

        fp60.setDefault(0.2);


}


var bInit = false;

var xClose = null;

var xLinReg = null;


function main(nLRlen, nLRThickness, nLRColor, sDisplay, nUpper, nLower) {

    if (bInit == false) {

        setDefaultBarThickness(nLRThickness, 0);

        setDefaultBarFgColor(nLRColor, 0);

        if (sDisplay == "Histogram") {

            setPlotType(PLOTTYPE_HISTOGRAM, 0);

        } else {

            setPlotType(PLOTTYPE_LINE, 0);

        }

        addBand(nUpper, PS_SOLID, 1, Color.blue, "upperBand");

        addBand(nLower, PS_SOLID, 1, Color.blue, "lowerBand");

        xClose = close();

        xLinReg = efsInternal("LinReg", nLRlen, xClose);

        bInit = true;

    }


    if (xLinReg.getValue(0) != null) {

        var A = getSeries(xLinReg, 0);  // Slope

        var B = getSeries(xLinReg, 1);  // y-intercept

        var R = getSeries(xLinReg, 2);  // R-Squared

    }


    return R;

}


function LinReg(nLRlen, x) {

    if (x.getValue(-nLRlen) == null) return;


    var xSum = 0;

    var ySum = 0;

    var sumXY = 0;

    var sumX2 = 0;

    var sumY2 = 0;

    i = 0;

    for (i = 0; i < nLRlen; ++i) {

        var xVal = x.getValue(-i);

        xSum += (i+1);

        ySum += xVal;

        sumXY += ((i+1) * xVal);

        sumX2 += ((i+1) * (i+1));

        sumY2 += (xVal * xVal);

    }

    var xAvg = xSum/nLRlen;

    var yAvg = ySum/nLRlen;

    var aSum1 = 0;

    var aSum2 = 0;

    i = 0;

    for (i = 0; i < nLRlen; ++i) {

        aSum1 += (i-xAvg) * (x.getValue(-i)-yAvg);

        aSum2 += (i-xAvg)*(i-xAvg);

    }


    //  y = Ax + B;

    // A  = SUM( (x-xAVG)*(y-yAVG) ) / SUM( (x-xAVG)^2 )

    // A  = slope

    // B  = yAVG - (A*xAVG);

    // B  = y-intercept

    // R2 = r-squared or correlation coefficient


    var A = (aSum1 / aSum2);

    var B = yAvg - (A*xAvg);

    var R2 = Math.pow( (nLRlen * sumXY - xSum * ySum) /

         Math.sqrt( (nLRlen*sumX2- (xSum*xSum)) *

         (nLRlen*sumY2 - (ySum*ySum)) ) , 2);


    return new Array(A, B, R2);

}
PHP Code:
/*****************************************************************

Provided By : eSignal. (c) Copyright 2004

Study:        Linear Regression Slope

Version:      1.0


11/5/2006


Formula Parameters:                 Defaults:

    Periods                         8

    Thickness                       2

    Color                           blue

    Display                         Line

*****************************************************************/


function preMain() {

    setStudyTitle("Linear Regression Slope ");

    setCursorLabelName("Slope", 0);

    setDefaultBarFgColor(Color.blue, 0);

    setDefaultBarThickness(2, 0);

    setShowTitleParameters(false);


    var fp10 = new FunctionParameter("nLRlen", FunctionParameter.NUMBER);

        fp10.setName("Periods");

        fp10.setLowerLimit(1);

        fp10.setDefault(8);


    var fp20 = new FunctionParameter("nLRThickness", FunctionParameter.NUMBER);

        fp20.setName("Thickness");

        fp20.setLowerLimit(1);

        fp20.setDefault(2);


    var fp30 = new FunctionParameter("nLRColor", FunctionParameter.COLOR);

        fp30.setName("Color");

        fp30.setDefault(Color.blue);

    var fp40 = new FunctionParameter("sDisplay", FunctionParameter.STRING);

        fp40.setName("Display");

        fp40.addOption("Line");

        fp40.addOption("Histogram");

        fp40.setDefault("Line");

}


var bInit = false;

var xClose = null;

var xLinReg = null;


function main(nLRlen, nLRThickness, nLRColor, sDisplay) {

    if (bInit == false) {

        setDefaultBarThickness(nLRThickness, 0);

        setDefaultBarFgColor(nLRColor, 0);

        if (sDisplay == "Histogram") {

            setPlotType(PLOTTYPE_HISTOGRAM, 0);

        } else {

            setPlotType(PLOTTYPE_LINE, 0);

        }

        xClose = close();

        xLinReg = efsInternal("LinReg", nLRlen, xClose);

        bInit = true;

    }


    if (xLinReg.getValue(0) != null) {

        var A = getSeries(xLinReg, 0);  // Slope

        var B = getSeries(xLinReg, 1);  // y-intercept

        var R = getSeries(xLinReg, 2);  // R-Squared

    }


    return A;

}


function LinReg(nLRlen, x) {

    if (x.getValue(-nLRlen) == null) return;


    var xSum = 0;

    var ySum = 0;

    var sumXY = 0;

    var sumX2 = 0;

    var sumY2 = 0;

    i = 0;

    for (i = 0; i < nLRlen; ++i) {

        var xVal = x.getValue(-i);

        xSum += (i+1);

        ySum += xVal;

        sumXY += ((i+1) * xVal);

        sumX2 += ((i+1) * (i+1));

        sumY2 += (xVal * xVal);

    }

    var xAvg = xSum/nLRlen;

    var yAvg = ySum/nLRlen;

    var aSum1 = 0;

    var aSum2 = 0;

    i = 0;

    for (i = 0; i < nLRlen; ++i) {

        aSum1 += (i-xAvg) * (x.getValue(-i)-yAvg);

        aSum2 += (i-xAvg)*(i-xAvg);

    }


    //  y = Ax + B;

    // A  = SUM( (x-xAVG)*(y-yAVG) ) / SUM( (x-xAVG)^2 )

    // A  = slope

    // B  = yAVG - (A*xAVG);

    // B  = y-intercept

    // R2 = r-squared or correlation coefficient


    var A = (aSum1 / aSum2);

    var B = yAvg - (A*xAvg);

    var R2 = Math.pow( (nLRlen * sumXY - xSum * ySum) /

         Math.sqrt( (nLRlen*sumX2- (xSum*xSum)) *

         (nLRlen*sumY2 - (ySum*ySum)) ) , 2);


    return new Array(-A, B, R2);

}