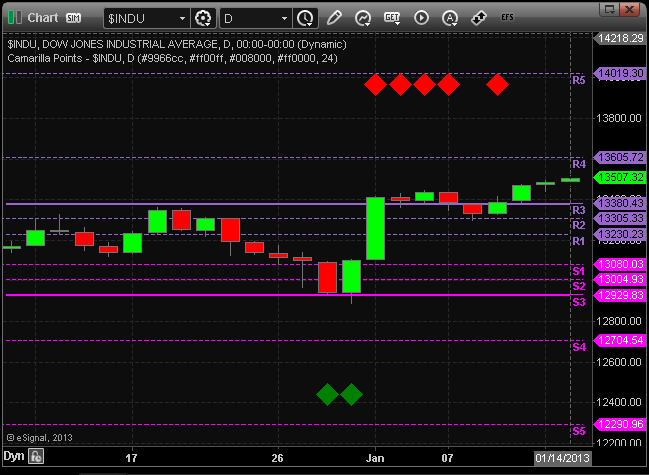
File Name: CamarillaPoints.efs
Description:
Camarilla Points, by Slawomir Bobrowski
Formula Parameters:
CamarillaPoints.efs
Resistance level Color purple
Support Level Color magenta
Buy Signal Color green
Sell Signal Color red
Time Frame Period 15
Notes:
The related article is copyrighted material. If you are not a subscriber
of Stocks & Commodities, please visit www.traders.com.
Download File:
CamarillaPoints.efs
CamarillaPoints.efs

EFS Code:
Description:
Camarilla Points, by Slawomir Bobrowski
Formula Parameters:
CamarillaPoints.efs
Resistance level Color purple
Support Level Color magenta
Buy Signal Color green
Sell Signal Color red
Time Frame Period 15
Notes:
The related article is copyrighted material. If you are not a subscriber
of Stocks & Commodities, please visit www.traders.com.
Download File:
CamarillaPoints.efs
CamarillaPoints.efs

EFS Code:
PHP Code:
/*********************************
Provided By:
eSignal (Copyright c eSignal), a division of Interactive Data
Corporation. 2012. All rights reserved. This sample eSignal
Formula Script (EFS) is for educational purposes only and may be
modified and saved under a new file name.  eSignal is not responsible
for the functionality once modified.  eSignal reserves the right
to modify and overwrite this EFS file with each new release.

Description:
    Camarilla Points, by Slawomir Bobrowski

Version:            1.00  01/10/2013

Formula Parameters:                         Default:
Resistance level Color                      purple
Support Level Color                         magenta
Buy Signal Color                            green
Sell Signal Color                           red
Time Frame Period                           15

Notes:
The related article is copyrighted material. If you are not a subscriber
of Stocks & Commodities, please visit www.traders.com.

**********************************/

var fpArray = new Array();

function preMain()
{
    setPriceStudy(true);
    setStudyTitle("Camarilla Points");

    setCursorLabelName("R5",0);
    setPlotType(PLOTTYPE_FLATLINES,0);
    setCursorLabelName("R4",1);
    setPlotType(PLOTTYPE_FLATLINES,1);
    setCursorLabelName("R3",2);
    setPlotType(PLOTTYPE_FLATLINES,2);
    setCursorLabelName("R2",3);
    setPlotType(PLOTTYPE_FLATLINES,3);
    setCursorLabelName("R1",4);
    setPlotType(PLOTTYPE_FLATLINES,4);

    setCursorLabelName("S1",5);
    setPlotType(PLOTTYPE_FLATLINES,5);
    setCursorLabelName("S2",6);
    setPlotType(PLOTTYPE_FLATLINES,6);
    setCursorLabelName("S3",7);
    setPlotType(PLOTTYPE_FLATLINES,7);
    setCursorLabelName("S4",8);
    setPlotType(PLOTTYPE_FLATLINES,8);
    setCursorLabelName("S5",9);
    setPlotType(PLOTTYPE_FLATLINES,9);

    var x = 0;

    fpArray[x] = new FunctionParameter("gRColor", FunctionParameter.COLOR);
    with(fpArray[x++])
    {
        setName("Resistance level Color");
        setDefault(Color.purple);
    }

    fpArray[x] = new FunctionParameter("gSColor", FunctionParameter.COLOR);
    with(fpArray[x++])
    {
        setName("Support Level Color");
        setDefault(Color.magenta);
    }

    fpArray[x] = new FunctionParameter("gBuyColor", FunctionParameter.COLOR);
    with(fpArray[x++])
    {
        setName("Buy Signal Color");
        setDefault(Color.green);
    }

    fpArray[x] = new FunctionParameter("gSellColor", FunctionParameter.COLOR);
    with(fpArray[x++])
    {
        setName("Sell Signal Color");
        setDefault(Color.red);
    }

    fpArray[x] = new FunctionParameter("gDays", FunctionParameter.NUMBER);
    with(fpArray[x++])
    {
        setName("Time Frame Period");
        setDefault(15);
    }
}

var bInit = false;
var bVersion = null;

var xHHigh  = null;
var xLLow   = null;
var xClose = null;

var xHigh  = null;
var xLow   = null;

var nR1 = null;
var nS1 = null;
var nR2 = null;
var nS2 = null;
var nR3 = null;
var nS3 = null;
var nR4 = null;
var nS4 = null;
var nR5 = null;
var nS5 = null;

function main(gRColor,gSColor,gBuyColor,gSellColor,gDays)
{
    if (bVersion == null) bVersion = verify();
    if (bVersion == false) return;

    setDefaultBarFgColor(gRColor, 0);
    setBarStyle(PS_DASH,0);
    setDefaultBarFgColor(gRColor, 1);
    setBarStyle(PS_DASH,1);
    setDefaultBarFgColor(gRColor, 2);
    setDefaultBarThickness(2,2);
    setDefaultBarFgColor(gRColor, 3);
    setBarStyle(PS_DASH,3);
    setDefaultBarFgColor(gRColor, 4);
    setBarStyle(PS_DASH,4);

    setDefaultBarFgColor(gSColor, 5);
    setBarStyle(PS_DASH,5);
    setDefaultBarFgColor(gSColor, 6);
    setBarStyle(PS_DASH,6);
    setDefaultBarFgColor(gSColor, 7);
    setDefaultBarThickness(2,7);
    setDefaultBarFgColor(gSColor, 8);
    setBarStyle(PS_DASH,8);
    setDefaultBarFgColor(gSColor, 9);
    setBarStyle(PS_DASH,9);

    if(!bInit)
    {
        xHHigh  = highest(gDays,high());
        xLLow   = lowest(gDays,low());
        xClose = close();

        xHigh = high();
        xLow = low();

        bInit = true;
    }

    if (getBarState()==BARSTATE_ALLBARS)
    {
        nR5 = nR4 = nR3 = nR2 = nR1 = null;
        nS1 = nS2 = nS3 = nS4 = nS5 = null;
    }

    if ((getCurrentBarIndex()-1) % (gDays) == 0)
    {
        var nHHigh  = xHHigh.getValue(-1);
        var nLLow   = xLLow.getValue(-1);
        var nClose = xClose.getValue(-1);

        if(nHHigh == null || nLLow == null || nClose == null || nLLow == 0)
        return;

        var nRange = nHHigh-nLLow;

        nR5 = (nHHigh/nLLow)*nClose;
        nR4 = nClose+nRange*1.1/2;
        nR3 = nClose+nRange*1.1/4;
        nR2 = nClose+nRange*1.1/6;
        nR1 = nClose+nRange*1.1/12;

        nS1 = nClose-nRange*1.1/12;
        nS2 = nClose-nRange*1.1/6;
        nS3 = nClose-nRange*1.1/4;
        nS4 = nClose-nRange*1.1/2;
        nS5 = nClose-(nR5-nClose);


        drawTextAbsolute(getCurrentBarIndex()+gDays-1, nR1, " R1 ", gRColor, null, Text.LEFT | Text.BOLD | Text.ONTOP, null, null,getCurrentBarIndex());
        drawTextAbsolute(getCurrentBarIndex()+gDays-1, nR2, " R2 ", gRColor, null, Text.LEFT | Text.BOLD | Text.ONTOP, null, null,getCurrentBarIndex()+1);
        drawTextAbsolute(getCurrentBarIndex()+gDays-1, nR3, " R3 ", gRColor, null, Text.LEFT | Text.BOLD | Text.ONTOP, null, null,getCurrentBarIndex()+2);
        drawTextAbsolute(getCurrentBarIndex()+gDays-1, nR4, " R4 ", gRColor, null, Text.LEFT | Text.BOLD | Text.ONTOP, null, null,getCurrentBarIndex()+3);
        drawTextAbsolute(getCurrentBarIndex()+gDays-1, nR5, " R5 ", gRColor, null, Text.LEFT | Text.BOLD | Text.ONTOP, null, null,getCurrentBarIndex()+4);

        drawTextAbsolute(getCurrentBarIndex()+gDays-1, nS1, " S1 ", gSColor, null, Text.LEFT | Text.BOLD | Text.ONTOP, null, null,getCurrentBarIndex()+5);
        drawTextAbsolute(getCurrentBarIndex()+gDays-1, nS2, " S2 ", gSColor, null, Text.LEFT | Text.BOLD | Text.ONTOP, null, null,getCurrentBarIndex()+6);
        drawTextAbsolute(getCurrentBarIndex()+gDays-1, nS3, " S3 ", gSColor, null, Text.LEFT | Text.BOLD | Text.ONTOP, null, null,getCurrentBarIndex()+7);
        drawTextAbsolute(getCurrentBarIndex()+gDays-1, nS4, " S4 ", gSColor, null, Text.LEFT | Text.BOLD | Text.ONTOP, null, null,getCurrentBarIndex()+8);
        drawTextAbsolute(getCurrentBarIndex()+gDays-1, nS5, " S5 ", gSColor, null, Text.LEFT | Text.BOLD | Text.ONTOP, null, null,getCurrentBarIndex()+9);

    }

    var nHigh = xHigh.getValue(0);
    var nLow = xLow.getValue(0);

    if(nHigh == null || nLow == null)
    return;

    if ((nR3<nHigh) && (nR3>nLow)) drawShapeRelative(0, TopRow3 , Shape.DIAMOND, null, gSellColor, Shape.PRESET);
    if ((nS3<nHigh) && (nS3>nLow)) drawShapeRelative(0, BottomRow3 , Shape.DIAMOND, null, gBuyColor, Shape.PRESET);

    return new Array(nR5,nR4,nR3,nR2,nR1,nS1, nS2, nS3,nS4,nS5);
}

function verify() {
    var b = false;
    if (getBuildNumber() < 779) {
        drawTextAbsolute(5, 35, "This study requires version 8.0 or later.",
            Color.white, Color.blue, Text.RELATIVETOBOTTOM|Text.RELATIVETOLEFT|Text.BOLD|Text.LEFT,
            null, 13, "error");
        drawTextAbsolute(5, 20, "Click HERE to upgrade.@URL=http://www.esignal.com/download/default.asp",
            Color.white, Color.blue, Text.RELATIVETOBOTTOM|Text.RELATIVETOLEFT|Text.BOLD|Text.LEFT,
            null, 13, "upgrade");
        return b;
    } else {
        b = true;
    }
    return b;
}