 Tweet
Tweet
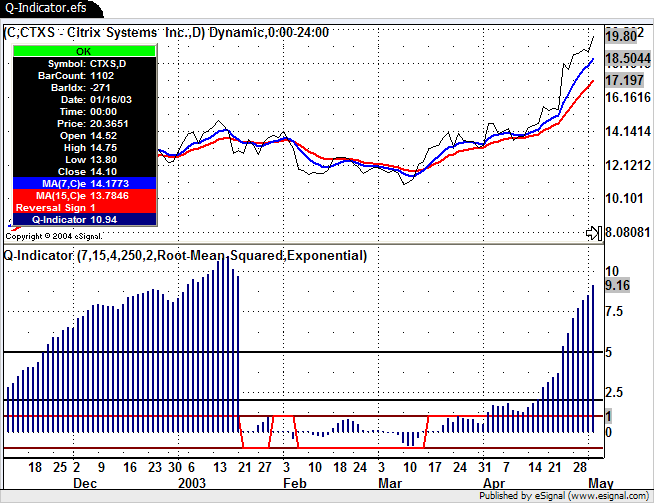
File Name: Q-Indicator.efs
Description:
Based on Trend-Quality Indicator by David Sepiashvili. This article appeared in the April 2004 issue of Stock & Commodities.
Formula Parameters:
MA1 Periods - 7
MA2 Periods -15
Scalar Trend Periods - 4
Scalar Noise Periods - 250
Scalar Correction Factor - 2
Noise Type – Root-Mean-Squared [Linear, Root-Mean-Squared]
CPC Smoothing – Exponential [Simple, Exponential]
Notes:
The related article is copyrighted material. If you are not a subscriber of Stocks & Commodities, please visit www.traders.com.
Download File:
Q-Indicator.efs
EFS Code:
PHP Code:
/***********************************************

Provided By : eSignal. (c) Copyright 2004

Study:        Q-Indicator

Version:      1.0


2/10/2004


Formula Parameters:                 Default:

    MA1 Periods                     7

    MA2 Periods                     15

    Scalar Trend Periods            4

    Scalar Noise Periods            250

    Scalar Correction Factor        2

    Noise Type                      Root-Mean-Squared

    CPC Smoothing                   Exponential


Notes:

    * This version uses an EMA(7)/EMA(15) crossover study for the

      basis of the indicator calculations in the background.  To

      view the moving averages on the price pane, they must be

      applied separately with the same inputs for length.

    * It is recommended that the advanced chart uses a custom time

      template equal to at least twice the number of bars than the

      length specified for the Scalar Noise Periods of 250.


********************************************/


function preMain() {

    setStudyTitle("Q-Indicator ");

    setCursorLabelName("Reversal Sign", 0);

    setCursorLabelName("Q-Indicator", 1);

    setComputeOnClose();


    setPlotType(PLOTTYPE_HISTOGRAM, 1);

    setDefaultBarFgColor(Color.red, 0);

    setDefaultBarFgColor(Color.navy, 1);

    setDefaultBarThickness(2, 0);

    setDefaultBarThickness(3, 1);


    addBand(5, PS_SOLID, 2, Color.black, "+5");

    addBand(2, PS_SOLID, 2, Color.black, "+2");

    addBand(1, PS_SOLID, 2, Color.maroon, "+1");

    addBand(-1, PS_SOLID, 2, Color.maroon, "-1");

    addBand(-2, PS_SOLID, 2, Color.black, "-2");

    addBand(-5, PS_SOLID, 2, Color.black, "-5");


    var fp1 = new FunctionParameter("nLen1", FunctionParameter.NUMBER);

    fp1.setName("MA1 Periods");

    fp1.setLowerLimit(1);

    fp1.setDefault(7);


    var fp2 = new FunctionParameter("nLen2", FunctionParameter.NUMBER);

    fp2.setName("MA2 Periods");

    fp2.setLowerLimit(1);

    fp2.setDefault(15);


    var fp3 = new FunctionParameter("nTrendLen", FunctionParameter.NUMBER);

    fp3.setName("Scalar Trend Periods");

    fp3.setLowerLimit(1);

    fp3.setDefault(4);


    var fp4 = new FunctionParameter("nNoiseLen", FunctionParameter.NUMBER);

    fp4.setName("Scalar Noise Periods");

    fp4.setLowerLimit(1);

    fp4.setDefault(250);


    var fp5 = new FunctionParameter("nC", FunctionParameter.NUMBER);

    fp5.setName("Scalar Correction Factor");

    fp5.setLowerLimit(0);

    fp5.setDefault(2);


    var fp6 = new FunctionParameter("sType", FunctionParameter.STRING);

    fp6.setName("Noise Type");

    fp6.addOption("Linear");

    fp6.addOption("Root-Mean-Squared");

    fp6.setDefault("Root-Mean-Squared");


    var fp7 = new FunctionParameter("sCPCsmoothing", FunctionParameter.STRING);

    fp7.setName("CPC Smoothing");

    fp7.addOption("Simple");

    fp7.addOption("Exponential");

    fp7.setDefault("Exponential");

}


var bEdit = true;

var MAstudy1 = null;

var MAstudy2 = null;


var nRevPeriods = 0;

var aDC = null;

var aCPC = null;

var CPC = null;

var aDT = null;

var DT = null;

var vSign = null;


// EMA variables

var vEMA = null;

var vEMA1 = null;

var dPercent = 0.0;

var bPrimed = false;


function main(nLen1, nLen2, nTrendLen, nNoiseLen, nC, sType, sCPCsmoothing) {

    var nState = getBarState();

    var i = 0;

    var vC = close();

    var vC_1 = close(-1);

    if (vC_1 == null) return;

    var DC = 0;

    var Trend = 0;

    var Noise = 1;

    var dSum = 0;

    var dSum2 = 0;

    var vQ = null;


    if (bEdit == true) {

        MAstudy1 = new MAStudy(Math.round(nLen1), 0, "Close", MAStudy.EXPONENTIAL);

        MAstudy2 = new MAStudy(Math.round(nLen2), 0, "Close", MAStudy.EXPONENTIAL);

        if (aDC == null) aDC = new Array(1);

        if (aCPC == null) aCPC = new Array(Math.round(nTrendLen));

        if (aDT == null) aDT = new Array(Math.round(nNoiseLen));

        bEdit = false;

    }


    if (nState == BARSTATE_NEWBAR) {    // crossovers

        var vEMA1 = MAstudy1.getValue(MAStudy.MA, 0);

        var vEMA2 = MAstudy2.getValue(MAStudy.MA, 0);

        var vEMA1_1 = MAstudy1.getValue(MAStudy.MA, -1);

        var vEMA2_1 = MAstudy2.getValue(MAStudy.MA, -1);

        if (vEMA1 == null || vEMA2 == null || vEMA1_1 == null || vEMA2_1 == null) return;

        if ( (vEMA1 > vEMA2 && vEMA1_1 < vEMA2_1) || (vEMA1 < vEMA2 && vEMA1_1 > vEMA2_1) ) {

            nRevPeriods = 0;

            if ( (vEMA1_1 - vEMA2_1) > 0) vSign = -1;

            if ( (vEMA1_1 - vEMA2_1) < 0) vSign = +1;

            aDC = new Array(1);

            aCPC = new Array(Math.round(nTrendLen));

            CPC = null;

            bPrimed = false;

        } else {

            nRevPeriods += 1;

        }

        if (CPC != null) {

            aCPC.pop();

            aCPC.unshift(CPC);

        }

        if (DT != null) {

            aDT.pop();

            aDT.unshift(DT);

        }

    }


    // DC

    DC = (vC - vC_1);

    aDC[nRevPeriods] = DC;


    // CPC

    CPC = 0;

    for(i = 0; i < nRevPeriods+1; ++i) {

        CPC += aDC[i];

    }

    aCPC[0] = CPC


    // Trend

    if (nRevPeriods > 0) {

        if (sCPCsmoothing == "Exponential") {

            if (aCPC[nTrendLen-1] != null) {

                vEMA = EMA(nTrendLen, aCPC);

                Trend = vEMA;

            } else {

                i = 0;

                for (i = 0; i < nRevPeriods+1; ++i) {

                    dSum2 += aCPC[i];

                }

                Trend = (dSum2/(nRevPeriods+1));

            }

        } else if (sCPCsmoothing == "Simple") {

            i = 0;

            for (i = 0; i < Math.min((nRevPeriods+1),nTrendLen); ++i) {

                dSum2 += aCPC[i];

            }

            Trend = (dSum2/Math.min((nRevPeriods+1),nTrendLen));

        }

    }


    // Noise

    if (sType == "Root-Mean-Squared") {

        DT = (CPC - Trend)*(CPC - Trend);

        aDT[0] = DT;

        if (aDT[nNoiseLen-1] != null) {

            i = 0;

            for (i = 0; i < nNoiseLen; ++i) {

                dSum += aDT[i];

            }

            dSum /= nNoiseLen;

            Noise = Math.sqrt(dSum) * nC;

        }

    } else if (sType == "Linear") {

        DT = Math.abs(CPC - Trend);

        aDT[0] = DT;

        if (aDT[nNoiseLen-1] != null) {

            i = 0;

            for (i = 0; i < nNoiseLen; ++i) {

                dSum += aDT[i];

            }

            dSum /= nNoiseLen;

            Noise = dSum * nC;

        }

    }


    // Q-Indicator

    if (Noise != 0) {

        vQ = (Trend/Noise);

    }


    return new Array(vSign, vQ);

}


/***************

    Functions

****************/


function EMA(nLength, nArray) {

    var nBarState = getBarState();

    var dSum = 0.0;

    var dRef;


    if(nBarState == BARSTATE_ALLBARS || bPrimed == false) {

        dPercent = (2.0 / (nLength + 1.0));

        bPrimed = false;

    }


    if (nBarState == BARSTATE_NEWBAR) {

        vEMA1 = vEMA;

    }


    if(bPrimed == false) {

        for(i = 0; i < nLength; i++) {

            dSum += nArray[i];

        }

        bPrimed = true;

        return (dSum / nLength);

    } else {

        return (((CPC - vEMA1) * dPercent) + vEMA1);

    }

}