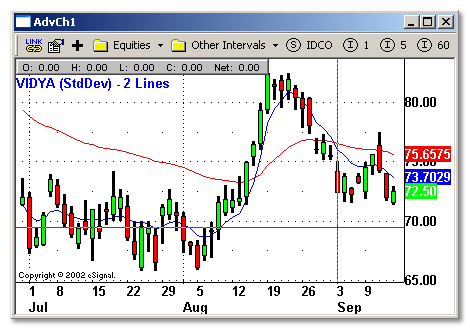
Our next indicator is VIDYA2 (StdDev).
Averages > [eSignal EFS Indicators]
Download: http://share.esignal.com/download.js...DYAStdDev2.efs
Category: Indicator > Averages
Description:
This indicator plots two Variable Index Adjusted Moving Averages (VIDYA),based on StdDev of prices as a measure of volatility on the same chart.
VIDYA is calculated according to this formula:
VIDYA = (Alpha x StdDev(n)/StdDev(ref) x Close) + (1-(Alpha x StdDev(n)/StdDev(ref))) x VIDYA[1],
where:
Alpha - numerical constant (corresponding roughly to a x-week exponential moving average)
StdDev(ref) - Average mean of StdDev for n periods
VIDYA tracks the market better than exponential moving averages do using a fixed smoothing constant. Trading strategies based on VIDYA should perform better than those based on exponential moving averages.
To get more information, refer Adaptive Moving Averages to Market Volatility article by T.Chande in March 1992 issue of Stocks&Commodities

Inputs:
Alpha1 - numerical constant for fast VIDYA
Alpha2 - numerical constant for slow VIDYA
sPrice - price data to use
Lenght - number of bars to calculate
EFS Code:
Averages > [eSignal EFS Indicators]
Download: http://share.esignal.com/download.js...DYAStdDev2.efs
Category: Indicator > Averages
Description:
This indicator plots two Variable Index Adjusted Moving Averages (VIDYA),based on StdDev of prices as a measure of volatility on the same chart.
VIDYA is calculated according to this formula:
VIDYA = (Alpha x StdDev(n)/StdDev(ref) x Close) + (1-(Alpha x StdDev(n)/StdDev(ref))) x VIDYA[1],
where:
Alpha - numerical constant (corresponding roughly to a x-week exponential moving average)
StdDev(ref) - Average mean of StdDev for n periods
VIDYA tracks the market better than exponential moving averages do using a fixed smoothing constant. Trading strategies based on VIDYA should perform better than those based on exponential moving averages.
To get more information, refer Adaptive Moving Averages to Market Volatility article by T.Chande in March 1992 issue of Stocks&Commodities

Inputs:
Alpha1 - numerical constant for fast VIDYA
Alpha2 - numerical constant for slow VIDYA
sPrice - price data to use
Lenght - number of bars to calculate
EFS Code:
Code:
/*******************************************************************
Description : This Indicator plots VIDYA StdDev2 indicator
Provided By : Developed by TS Support, LLC for eSignal. (c) Copyright 2002
********************************************************************/

function preMain()
{
    setPriceStudy(true);
    setStudyTitle("VIDYA (StdDev) - 2 Lines");
    setCursorLabelName("VIDYA1", 0);
    setCursorLabelName("VIDYA2", 1);
    setDefaultBarFgColor(Color.blue, 0);
    setDefaultBarFgColor(Color.red, 1);
}
var StdDevVidya1_1 = null;
var StdDevVidya2_1 = null;
var StdDev = null;
function main(Alpha1, Alpha2, sPrice, Length)
{
    var BarState = getBarState();
    if (Alpha1 == null) Alpha1 = 0.2;
    if (Alpha2 == null) Alpha2 = 0.04;
    if (sPrice == null) sPrice = "Close";
    if (Length == null) Length = 20;
    var Price = getValue(sPrice, 0, -(Length + 1));
    var i = 0;
    if ((StdDevVidya1_1 == null)||(StdDev == null)||(StdDevVidya2_1 == null))
    {
       StdDevVidya1_1 = Price[0];
       StdDevVidya2_1 = Price[0];
       StdDev = new Array(Length);
       for (i = 0; i < Length; i++)
       {
           StdDev[i] = 0.0;
       }
       return;
    }
    if (BarState == BARSTATE_NEWBAR)
    {
        for (i = Length - 1; i > 0; i--)
        {
            StdDev[i] = StdDev[i - 1];
        }
    }
    var Avg = 0.0;
    for (i = 0; i < Length; i++)
    {
        Avg += Price[i];
    }
    Avg /= Length;
    var SumSqr = 0.0;
    for (i = 0; i < Length; i++)
    {
        SumSqr += (Price[i] - Avg) * (Price[i] - Avg);
    }
    StdDev[0] = Math.sqrt(SumSqr / Length);
    Avg = 0.0;
    for (i = 0; i < Length; i++)
    {
        Avg += StdDev[i];
    }
    Avg /= Length;
    var StdDevVidya1 = (Alpha1 * (StdDev[0] / Avg) * Price[0]) + ((1 - (Alpha1 * (StdDev[0] / Avg))) * StdDevVidya1_1);
    var StdDevVidya2 = (Alpha2 * (StdDev[0] / Avg) * Price[0]) + ((1 - (Alpha2 * (StdDev[0] / Avg))) * StdDevVidya2_1);
    if (BarState == BARSTATE_NEWBAR)
    {
        StdDevVidya1_1 = StdDevVidya1;
        StdDevVidya2_1 = StdDevVidya2;
    }
    return new Array(StdDevVidya1, StdDevVidya2);
}