In this thread I hinted to the fact that Garth Doverspike was working on an improved version of an efs he had posted a while back (see here for the original thread and efs).
That improved version is now completed and has turned out to be a very effective and efficient efs.
The project started as a simple way to determine the Highest High and the Lowest Low in a chart. It then developed into a means of quickly calculating the Open, Highest High, Lowest Low and Close of any number of bars in a given interval and transposing those values to a lower interval so as to calculate and plot whatever other values one wanted (Pivots, Retracements, Expansions, other).
It also needed to work irrespective of any time related variable that could cause syncing problems.
At the same time the efs needed to be as modular as possible to allow anyone to easily hook into it for their own purposes.
Lastly it needed to be self sufficient ie not make use of other charts and/or efs.
The result is the attached efs.
What it does
The efs determines the Open, Highest High, Lowest Low and Close of any number of bars that are selected through Edit Studies. The default is set to 1 bar (ie the current one) and 0 offset, however the formula supports the use of other offsets and number of bars.
It calculates those values then asks you to switch to the lower interval where it plots them as horizontal lines.
The efs is semi-automatic in its operation in the sense that it does not roll forward automatically as new higher interval periods are added but it does recalculate and adjust the High and Low lines if the currently used higher interval posts new Highs or Lows.
On one hand the fact that the efs is not fully automatic may represent a disadvantage for some who instead want to use multiple intervals on a real time basis. On the other hand this efs offers the advantage of being very easy to use and very versatile at the same time. It does not depend on Time Templates, session hours or anything of the sort that may represent an obstacle in other situations. And it can be quickly adapted to perform a number of very different tasks.
Because of the way it is structured it is very easy to modify for most of the calculations for Pivots or static lines usually requested in the Forums.
Instructions are provided at the top of the formula and should be read carefully.
Interesting or useful sections of the code are explained with comments and the parts of the code one can hook into are clearly pointed out.
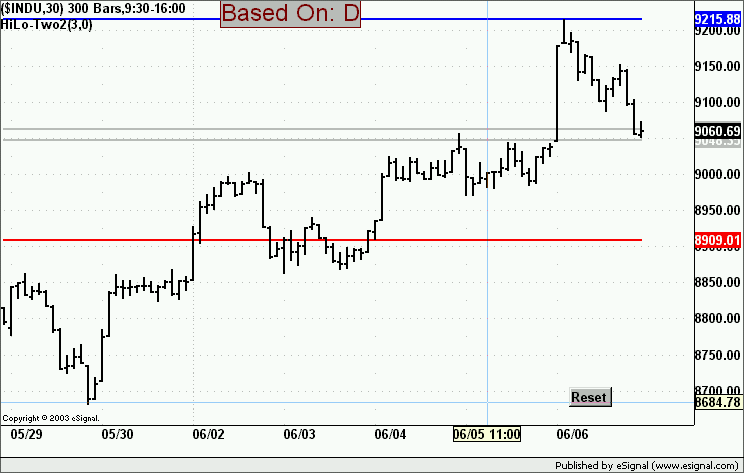
In the sample image below the efs is set to plot the High, Low and Close of 3 Daily bars and then calculate the two non standard Pivots requested by the user (see here).
Alex
pp/ Garth Doverspike
