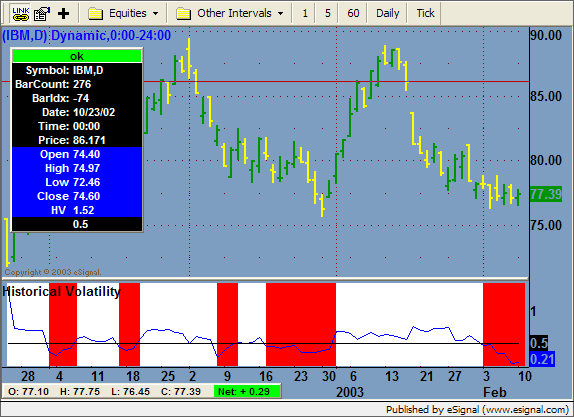
Can someone please help me convert Larry Connor's Historical 6/100 volatility.. from my metastock language...
((Std(Log(C/Ref(C,-1)),6)*Sqrt(256)*100) /
(Std(Log(C/Ref(C,-1)),100)*Sqrt(256)*100)) <=.5
----------------------------------------------------------------
In English:
Divide today’s close by yesterday’s close.
Take the natural log of #1.
Take the standard deviation of #2 for length desired (the number of trading days, i.e. 50)
Multiply #3 by 100.
Multiply #4 by the square root of the number of trading days in 1 year (256).
--------------------------
What you are doing is dividing the 6 by the 100 day historical volatility. When the value is less than .50 than you have abnormal low volatility..
--- My request.. can someone make this into an indicator by taking the 6/100 historical volaility and place .50 as a solid line?? Also can you paint the bars any time the same value is under .50??
---MIKE

Comment