 Tweet
Tweet
Below is a XTL question and a simple answer. If interested in learning more about the AGET XTL tool, click on the first link to go to Advanced GET User Group XTL post, or click on second link to load the "Overview of XTL" PDF file.
http://share.esignal.com/groupconten...XTL&groupid=20
http://share.esignal.com/ContentRoot...iew+Of+XTL.pdf
- - - - - - - - - - - - - - - - - - - - - - - - - - - - - - - - - - - - - - - - - -
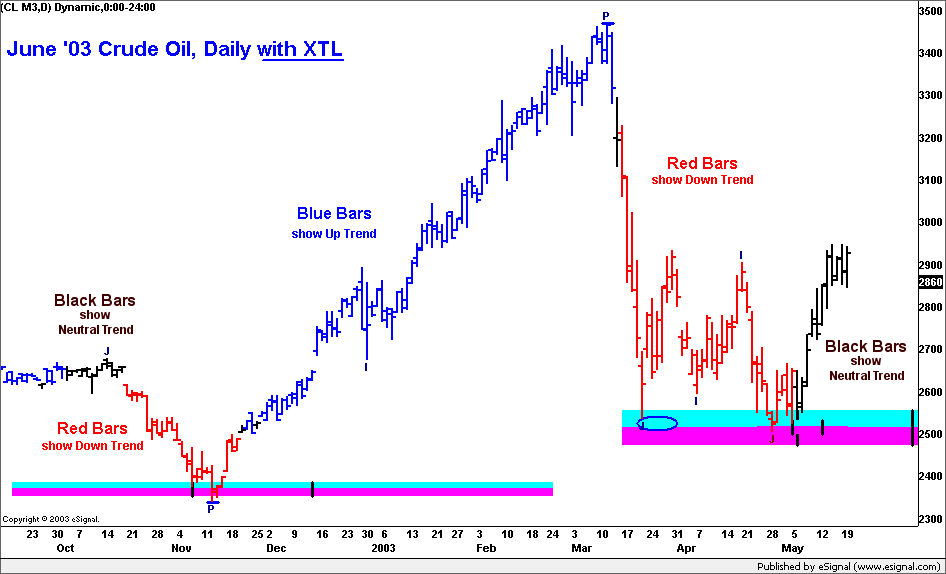
XTL Question: 1. On the XTL, what significance do the black bars have? Are they to be treated as breakout bars themselves? For example, if it's in a red trend and then black and then blue, and the black bars break out and close outside the moving average or trend channel and then another black bar exceeds that first bar's high/low by a few ticks, is this a signal or should I wait for the colored bars before I make an entry? -S.M.
- - - - - - - - - - - - - - - - - - - - - - - - - - - - - - - - - - - - - - - - - - - - - -
Answer: The primary purpose of the XTL is to help identify the early stages of a potential major Elliott Wave 3 building. Because of its simplicity of design and its powerful algorithm, it has become a primary tool used in other ways, such as a "continuation" trade. There are three colors for the XTL. The Black XLT represents "Neutral," or uncertainty as to the immediate direction. The Blue XTL would represent, or suggest, possible strength building or continuing. The Red XTL would represent the possibility of weakness building or continuing. The XTL works best when being considered as a tool used in an overall Type 1 or 2 buy or sell opportunity setup where other AGET tools and studies help reinforce the potential buy or sell setup. Black Bars are not breakout bars. They are neutral bars. They might suggest horizontal trading, or range trading. They would suggest the price movement could go either direction. If the data bar turns blue, and stays blue, it would suggest a possible trend may continue to the upside. If the data bar turns red and stays red, it would suggest a possible trend to the downside. If it stays either blue or red for a consistent time period, then turns black and later returns to that blue or red color, a continuation trade can be taken because of the expectation the previous trend is returning. As for specific trading strategies to use with the XTL, one might want to review the technical section and the video tapes to better understand XTL concepts. -mr
http://share.esignal.com/groupconten...XTL&groupid=20
http://share.esignal.com/ContentRoot...iew+Of+XTL.pdf
- - - - - - - - - - - - - - - - - - - - - - - - - - - - - - - - - - - - - - - - - -
XTL Question: 1. On the XTL, what significance do the black bars have? Are they to be treated as breakout bars themselves? For example, if it's in a red trend and then black and then blue, and the black bars break out and close outside the moving average or trend channel and then another black bar exceeds that first bar's high/low by a few ticks, is this a signal or should I wait for the colored bars before I make an entry? -S.M.
- - - - - - - - - - - - - - - - - - - - - - - - - - - - - - - - - - - - - - - - - - - - - -
Answer: The primary purpose of the XTL is to help identify the early stages of a potential major Elliott Wave 3 building. Because of its simplicity of design and its powerful algorithm, it has become a primary tool used in other ways, such as a "continuation" trade. There are three colors for the XTL. The Black XLT represents "Neutral," or uncertainty as to the immediate direction. The Blue XTL would represent, or suggest, possible strength building or continuing. The Red XTL would represent the possibility of weakness building or continuing. The XTL works best when being considered as a tool used in an overall Type 1 or 2 buy or sell opportunity setup where other AGET tools and studies help reinforce the potential buy or sell setup. Black Bars are not breakout bars. They are neutral bars. They might suggest horizontal trading, or range trading. They would suggest the price movement could go either direction. If the data bar turns blue, and stays blue, it would suggest a possible trend may continue to the upside. If the data bar turns red and stays red, it would suggest a possible trend to the downside. If it stays either blue or red for a consistent time period, then turns black and later returns to that blue or red color, a continuation trade can be taken because of the expectation the previous trend is returning. As for specific trading strategies to use with the XTL, one might want to review the technical section and the video tapes to better understand XTL concepts. -mr