Raycam,
We're not quite sure which window or Text you referring to when you say Market Identifier. Would you please provide more information or maybe a screenshot so that we can better assist you?
raycam
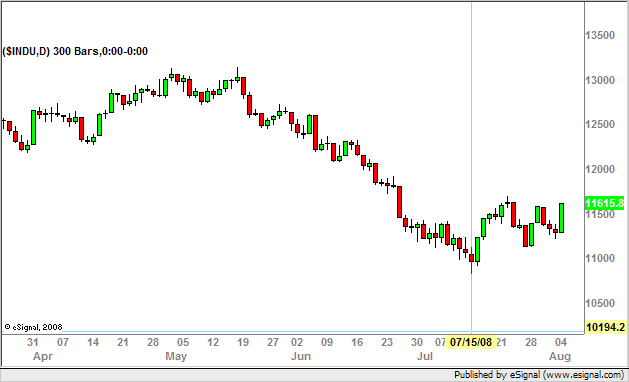
The chart you posted looks like an eSignal and not a LiveChart chart as one would be led to believe based on the fact that you posted your message in the LiveCharts forum
If that is the case then from your image it looks like you could have a number of studies running in the price pane which you have placed above the candles and are perhaps hidden. The following screenshot replicates what you are seeing
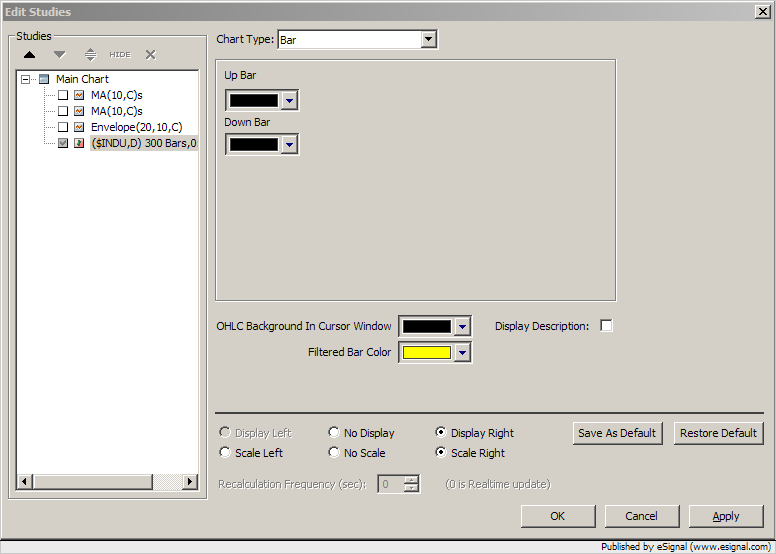
To verify if this is also your case right click the chart and select Edit Studies. Then check if your Studies list looks somewhat like the one shown in the following screenshot. The studies will very likely be different but their location will be above the symbol in the Main Chart section. You may also see that the checkbox next to each study is unchecked (which hides a study).
If that is the case select the symbol in the list and then click the Up arrow or drag the symbol until it is at the top of the Main Chart section. Then click each checkbox corresponding to a study (if they are unchecked).
Once you do that the symbol description (or market identifier to use your term) should be at the top of the chart and the studies visible
Hope this helps
Alex
Originally posted by raycam Here is a screenshot of my SP chart with the market info halfway down the chart. Its probably a dead easy fix- I just dont know it.
raycam
Looking closer at your image it is possible that your studies may not be hidden but were not displayed at the time you captured the screenshot simply because the data was still being loaded in the chart (the Server Status box in the Cursor Window was in fact still in Receiving mode).
Regardless of whether the studies are hidden or not the reason the symbol description is located towards the middle of the chart is very likely the one I illustrated in my previous message
Alex
raycam
You are most welcome and thank you for letting me know all is fine
Alex
Originally posted by raycam All fine. Thanks very much. ALl I had to do was click the up arrow in edit studies to move it to the top of the screen.
Ta
raycam
 Tweet
Tweet

Comment